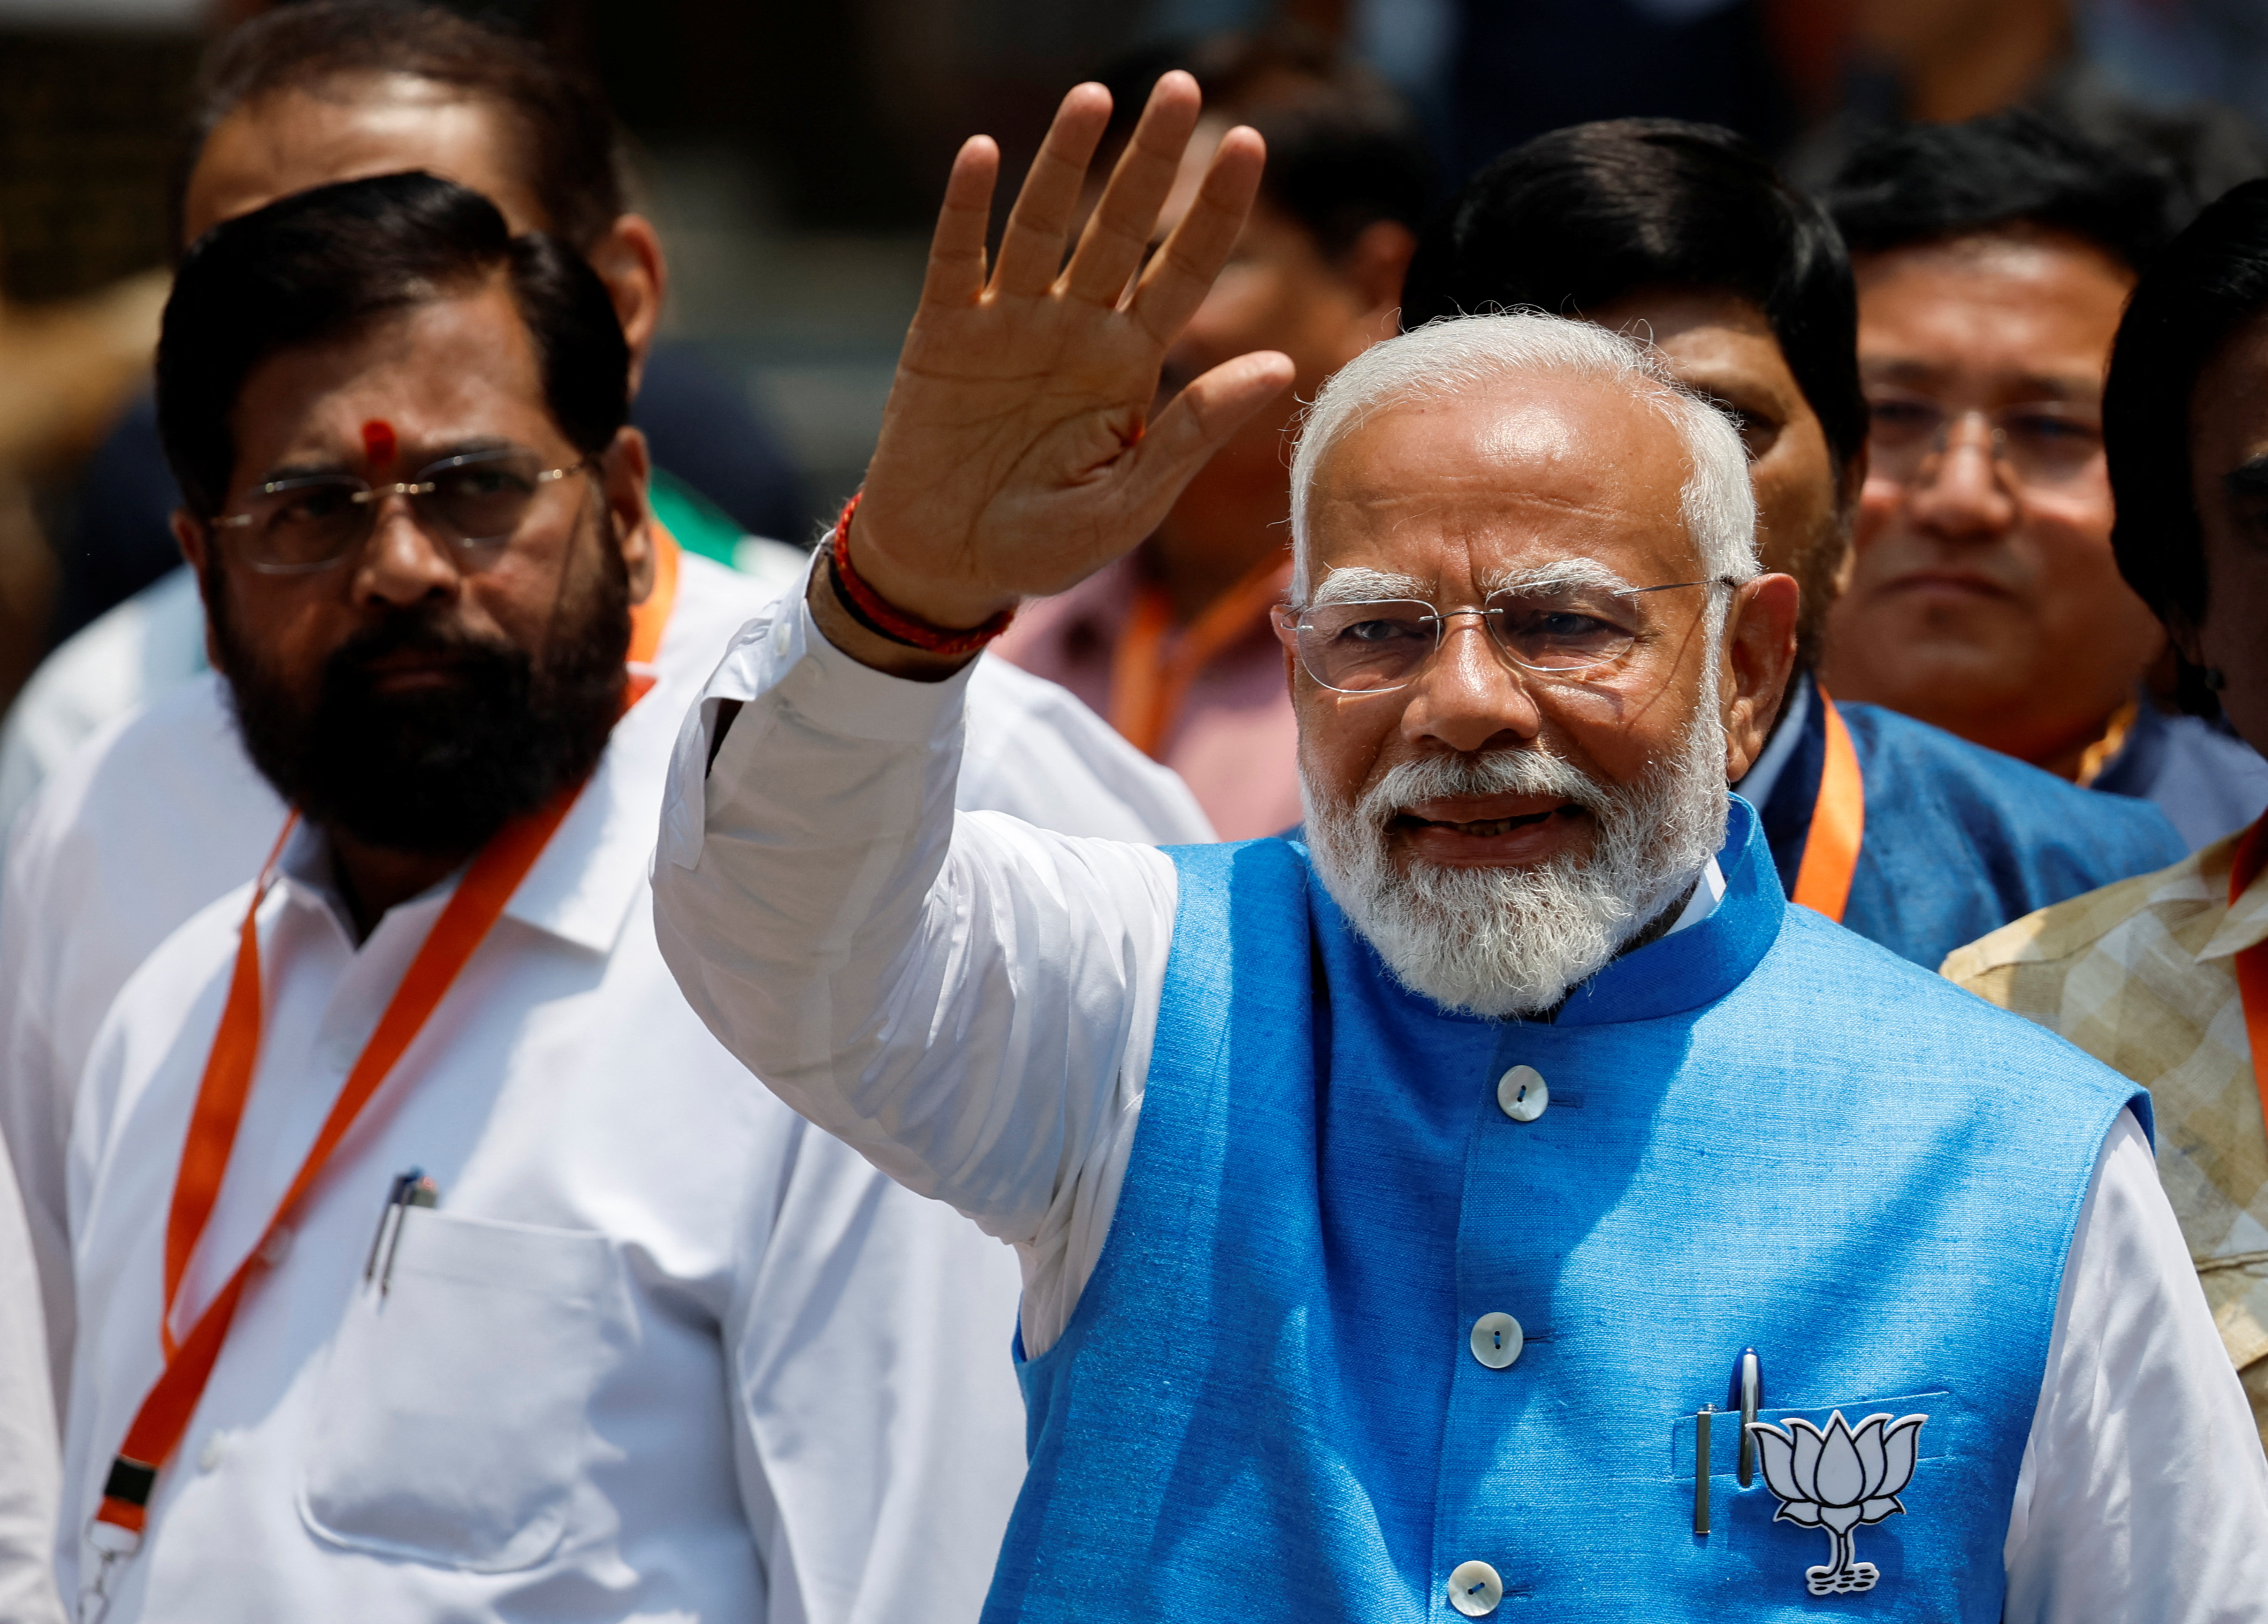
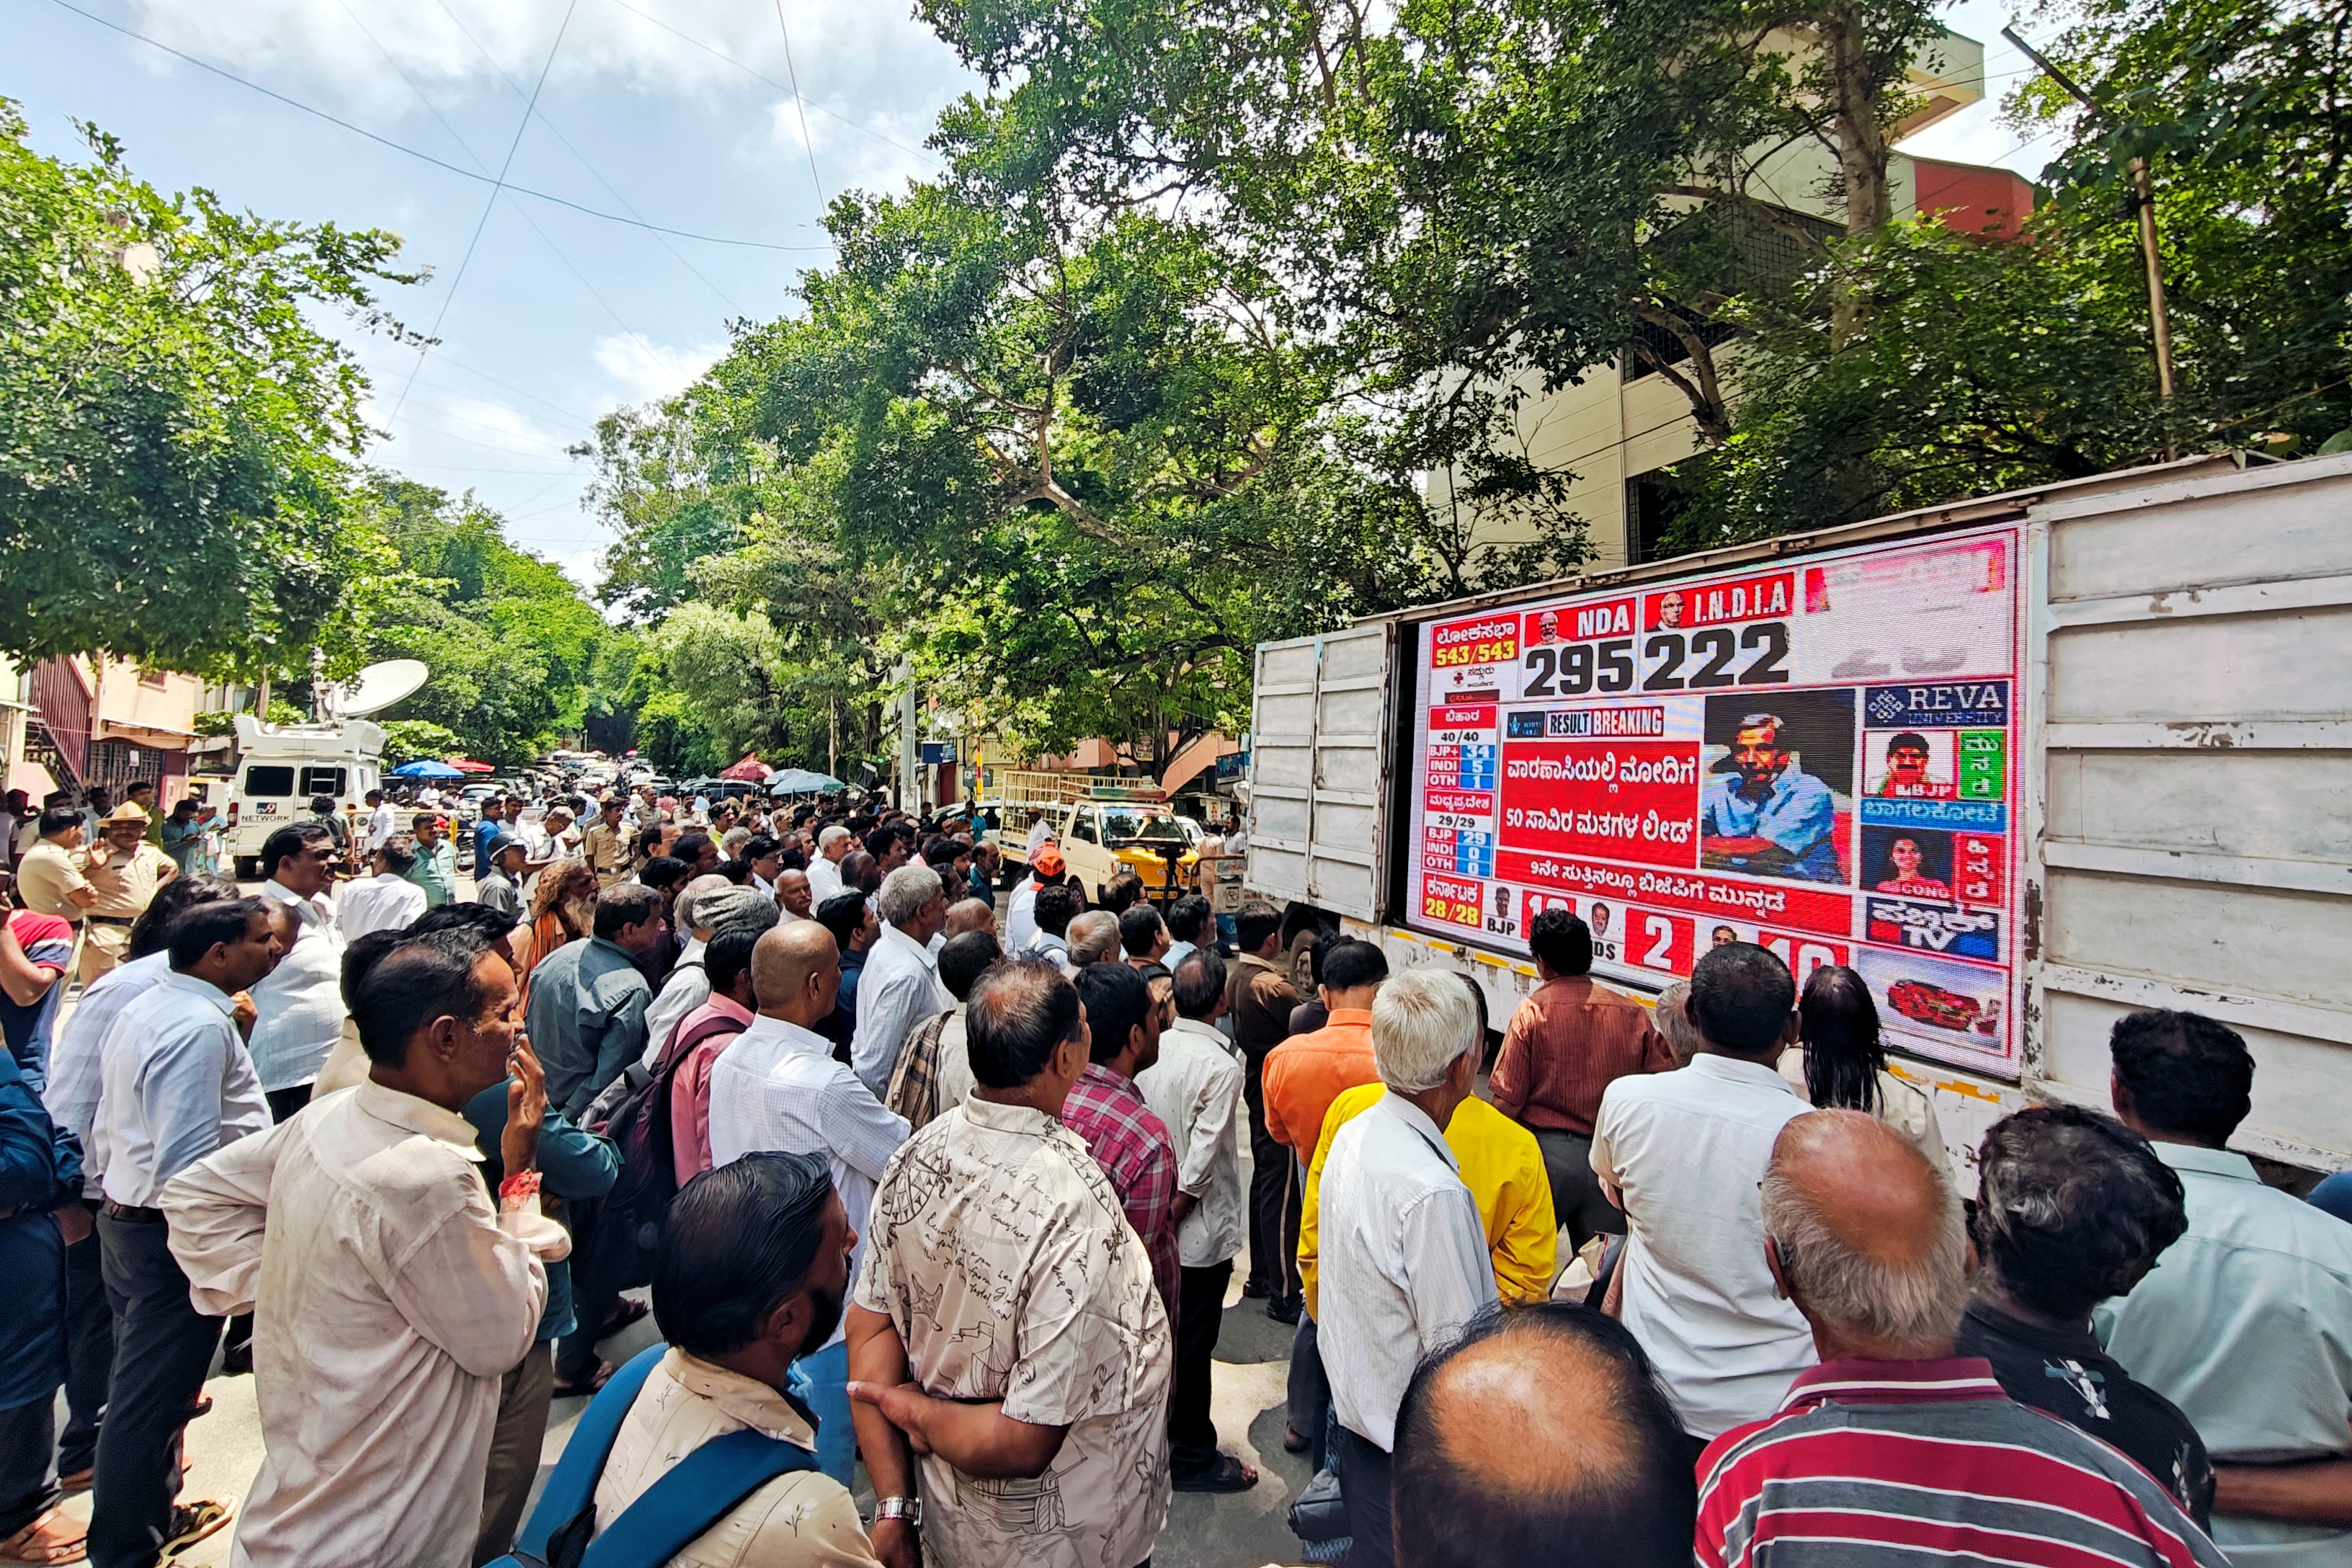
Narendra Modi's BJP-led alliance raced to a majority in early vote-counting trends, but the numbers were well short of the landslide predicted in India’s exit polls.
Supporters of the BJP watch a screen showing initial poll results outside in Bengaluru, India, June 4, 2024. REUTERS/Subhankar Dash - World
Indian Prime Minister Narendra Modi's alliance was winning a majority of seats about halfway through the count in the general election on Tuesday, but the numbers were well short of the landslide predicted in exit polls, TV channels said.
- World
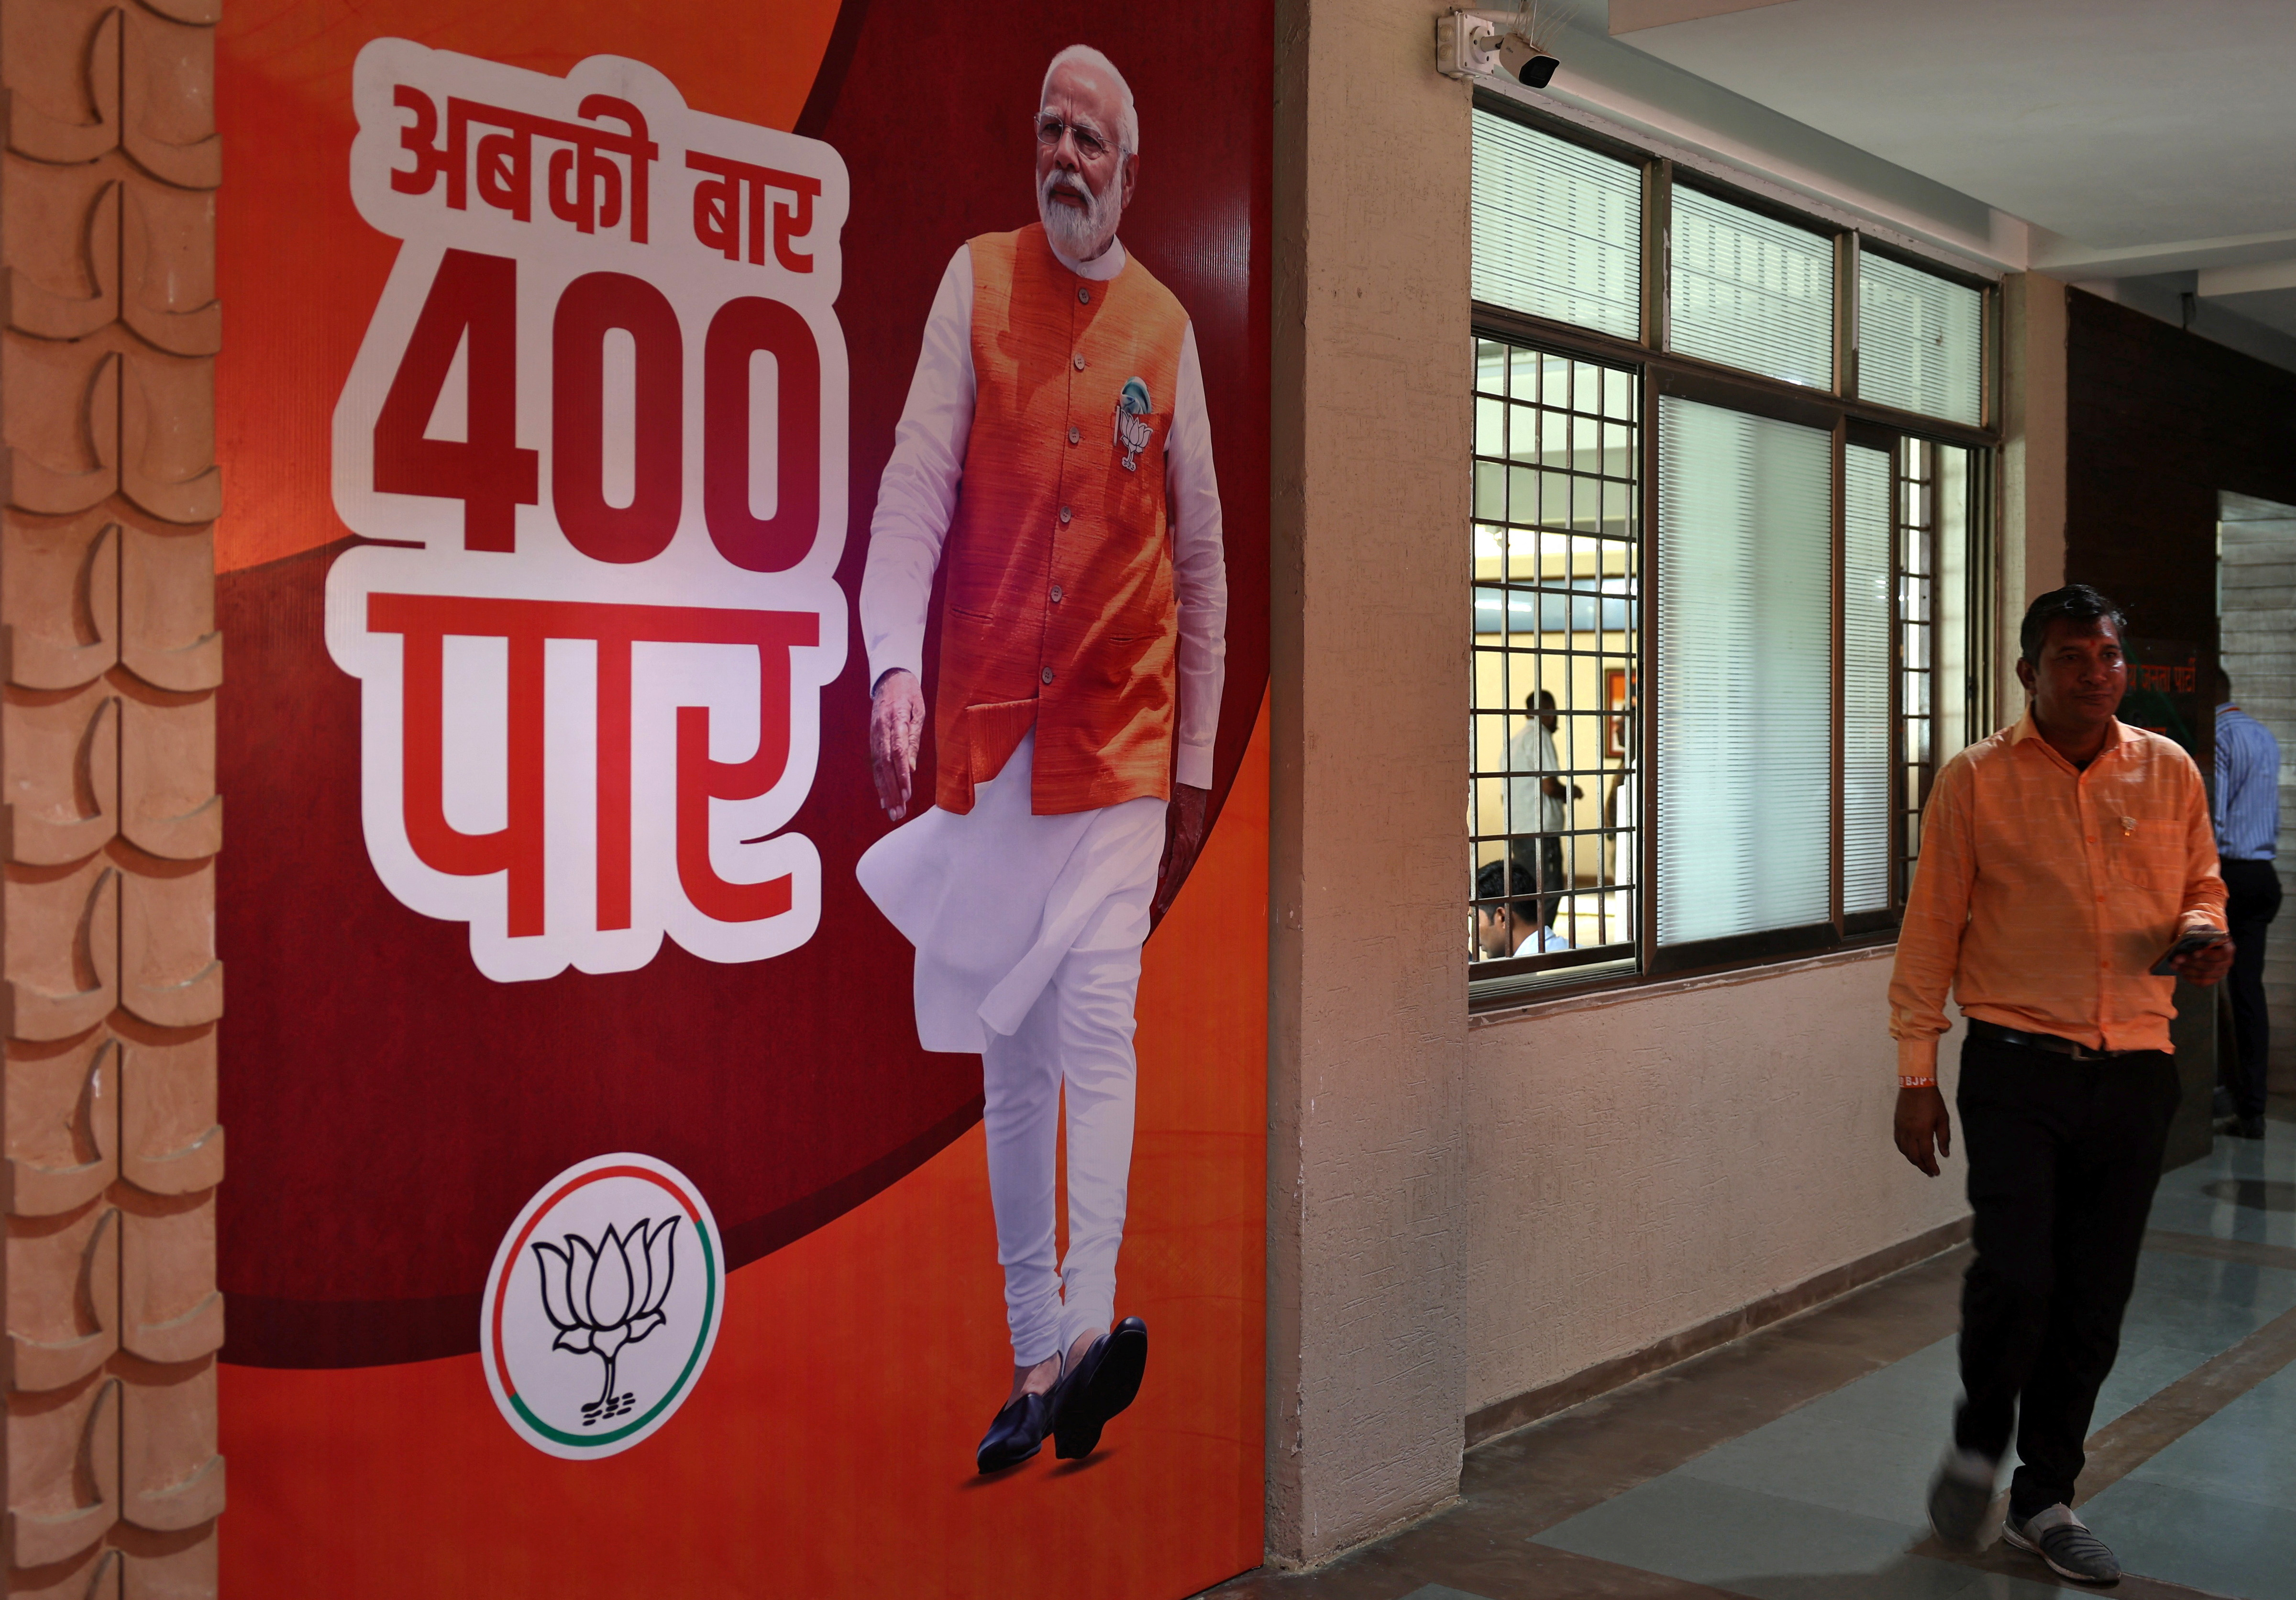
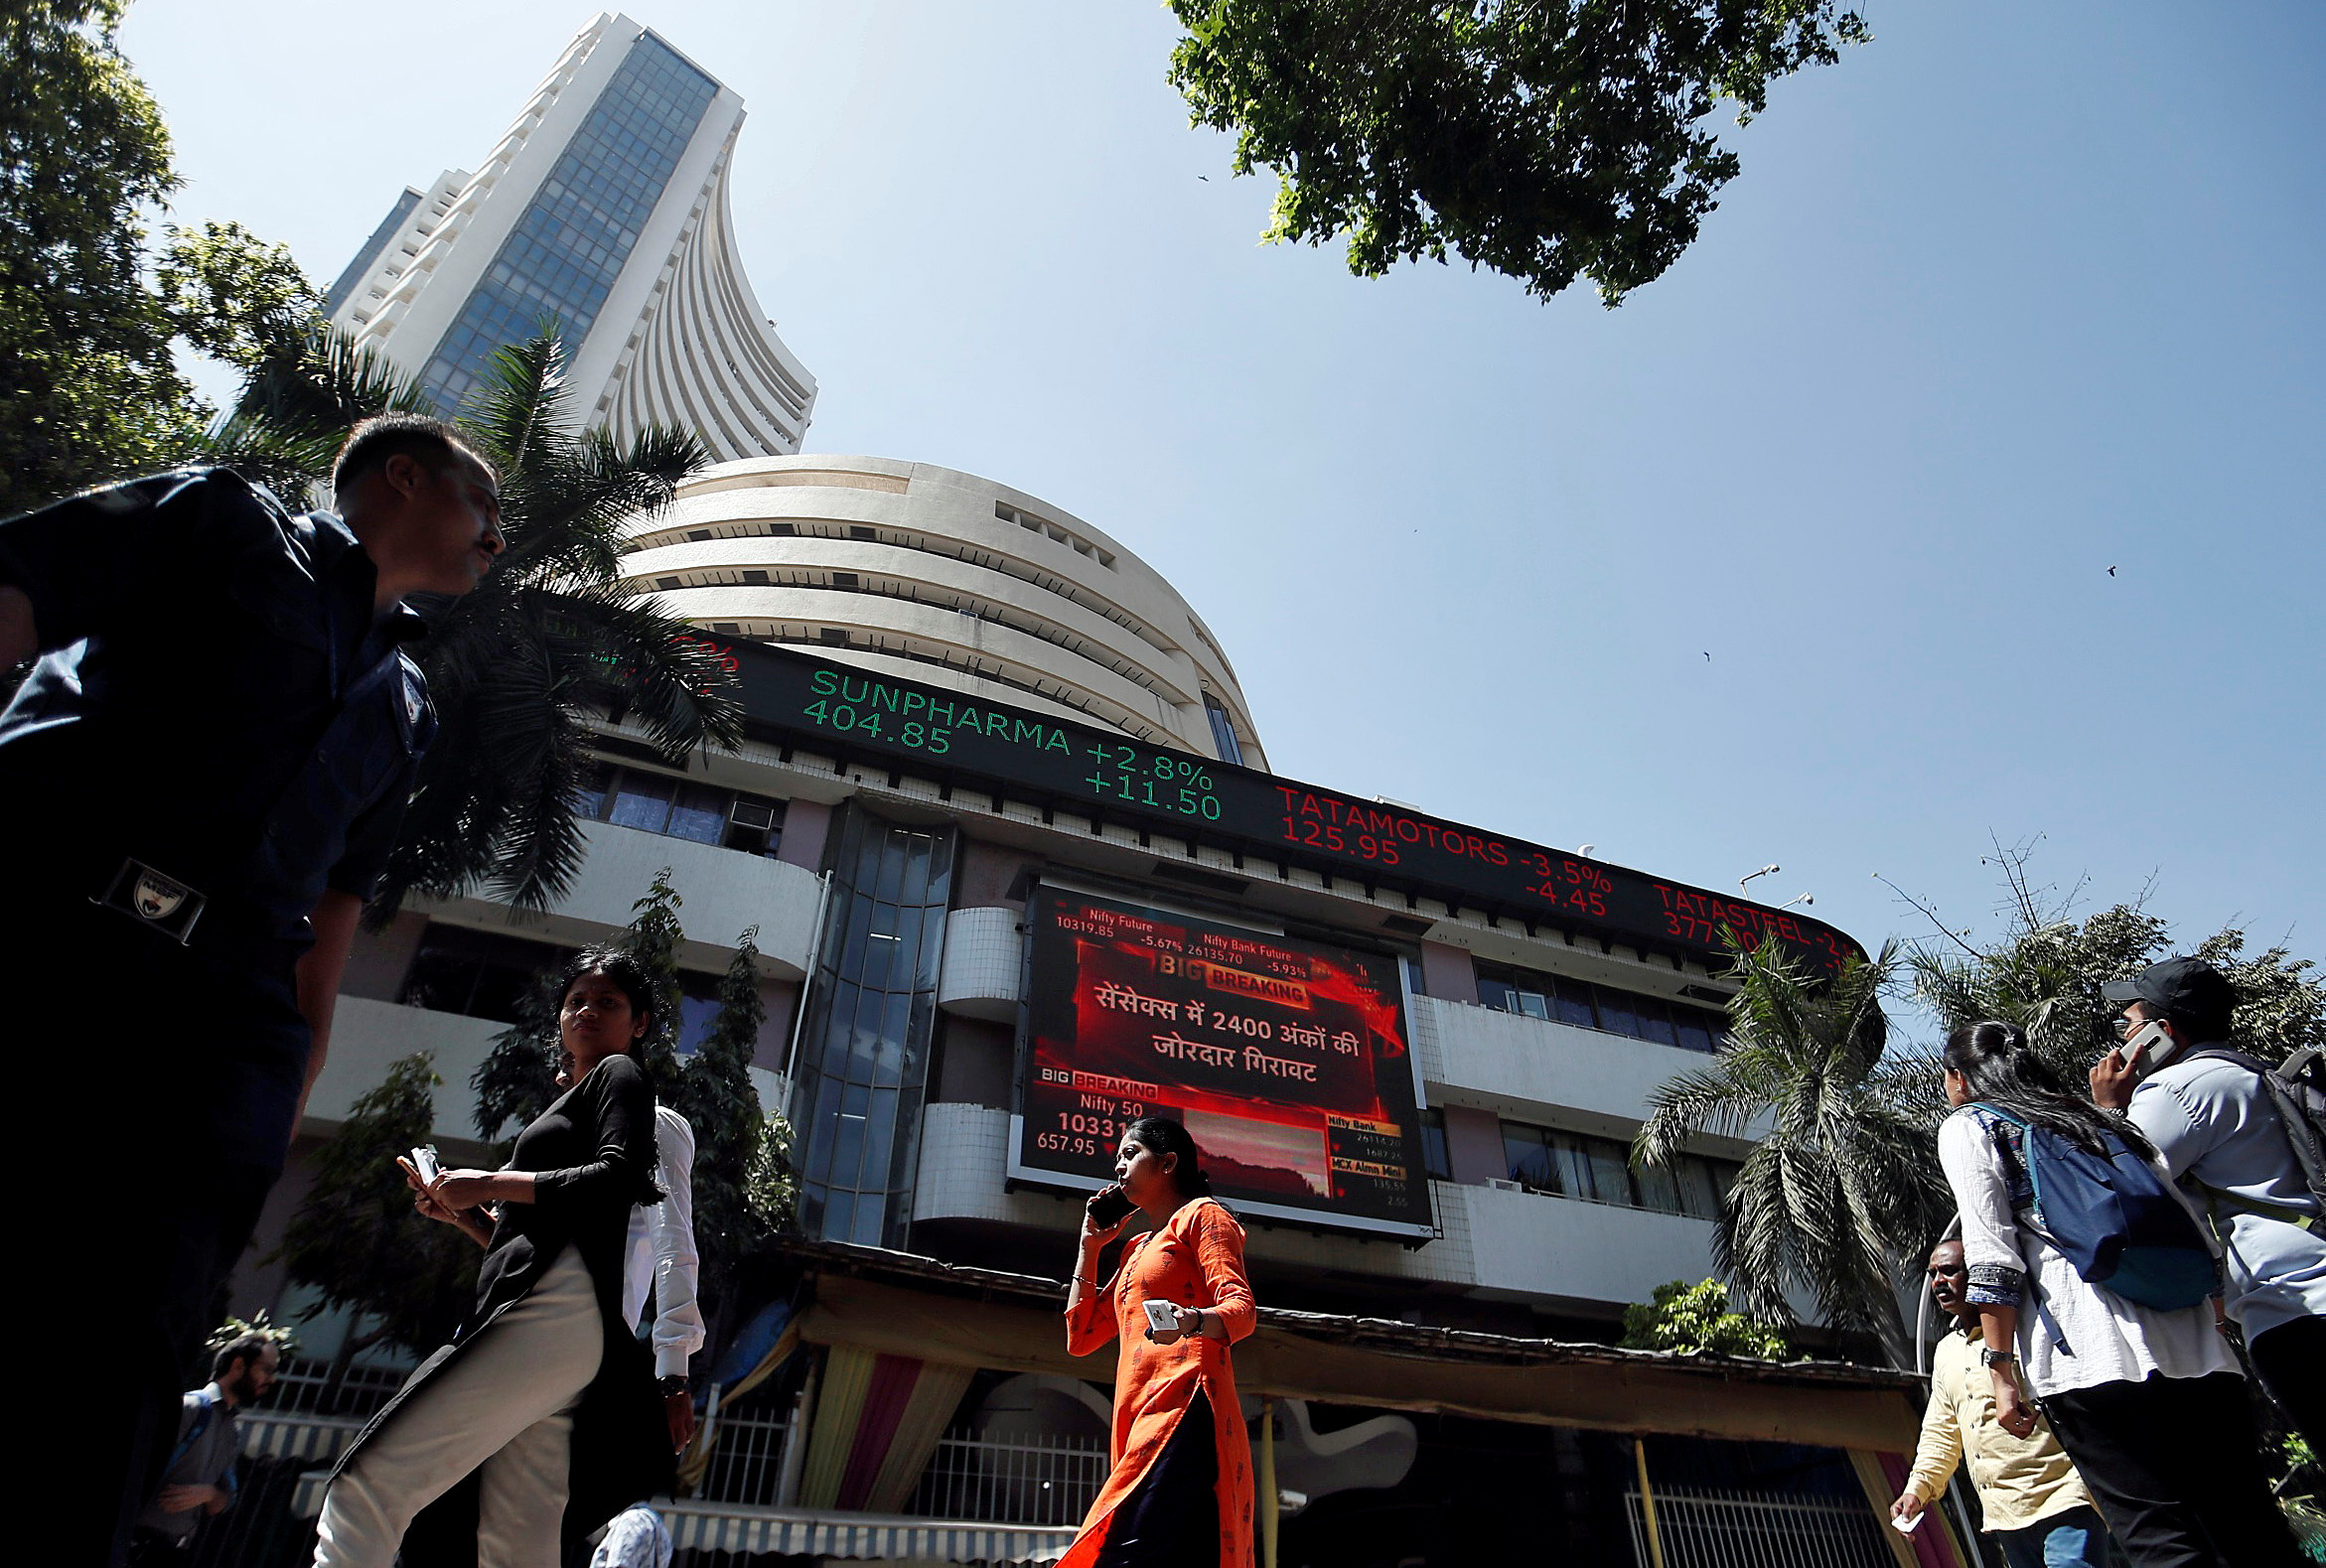
Indian stocks tanked the most in over four years on Tuesday, as vote counting suggested Prime Minister Narendra Modi's Bharatiya Janata Party (BJP)-led alliance is unlikely to win an overwhelming majority as predicted by exit polls.
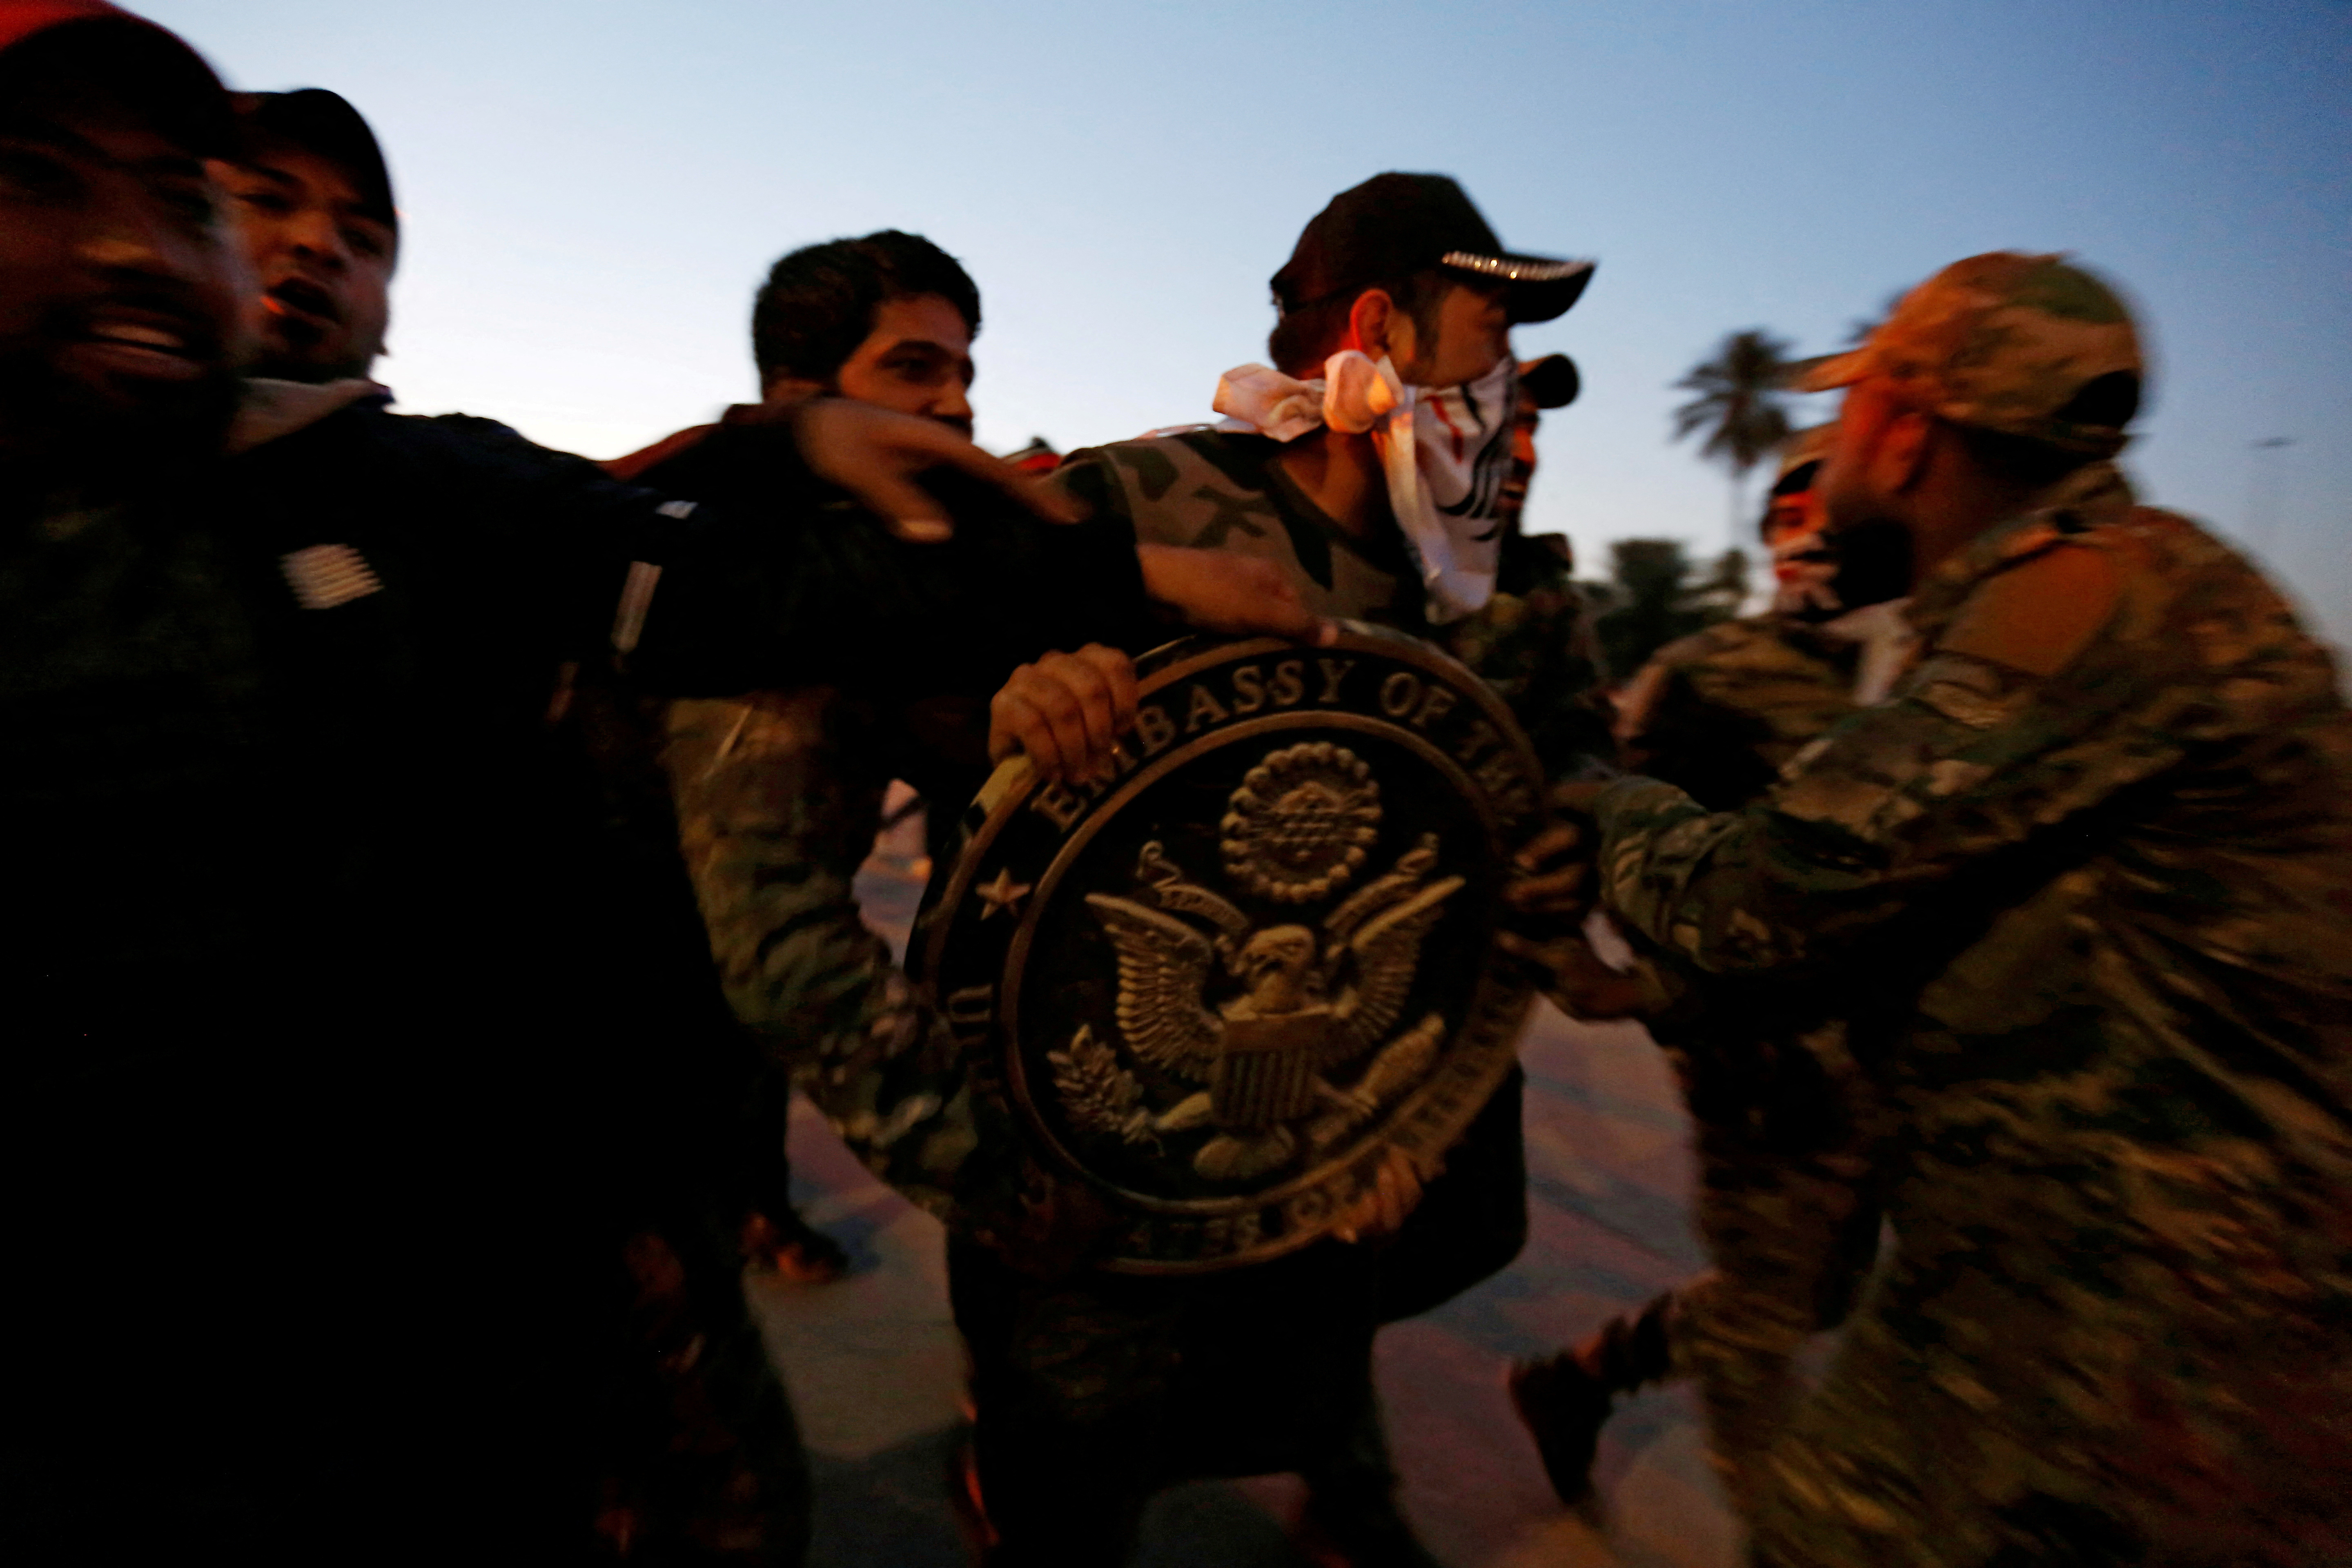
Iran-backed Shi'ite armed groups in Iraq have ramped up rocket and missile attacks on Israel in recent weeks, raising concerns in Washington and among some Iranian allies of potential Israeli retaliation and regional escalation should they draw blood.
Protesters and militia fighters carry the logo of the US Embassy during a protest to condemn air strikes on bases belonging to Hashd al-Shaabi, in Baghdad, December 31, 2019. REUTERS/Wissm al-Okili /File Photo - ANALYSIS
Nadir Aslam, a German of Moroccan-Pakistani heritage, had been planning to vote Green in this week's elections to the European Parliament. Instead, he will throw his support behind Mera25, a start-up leftist party with a clear pro-Palestinian stance.
- World
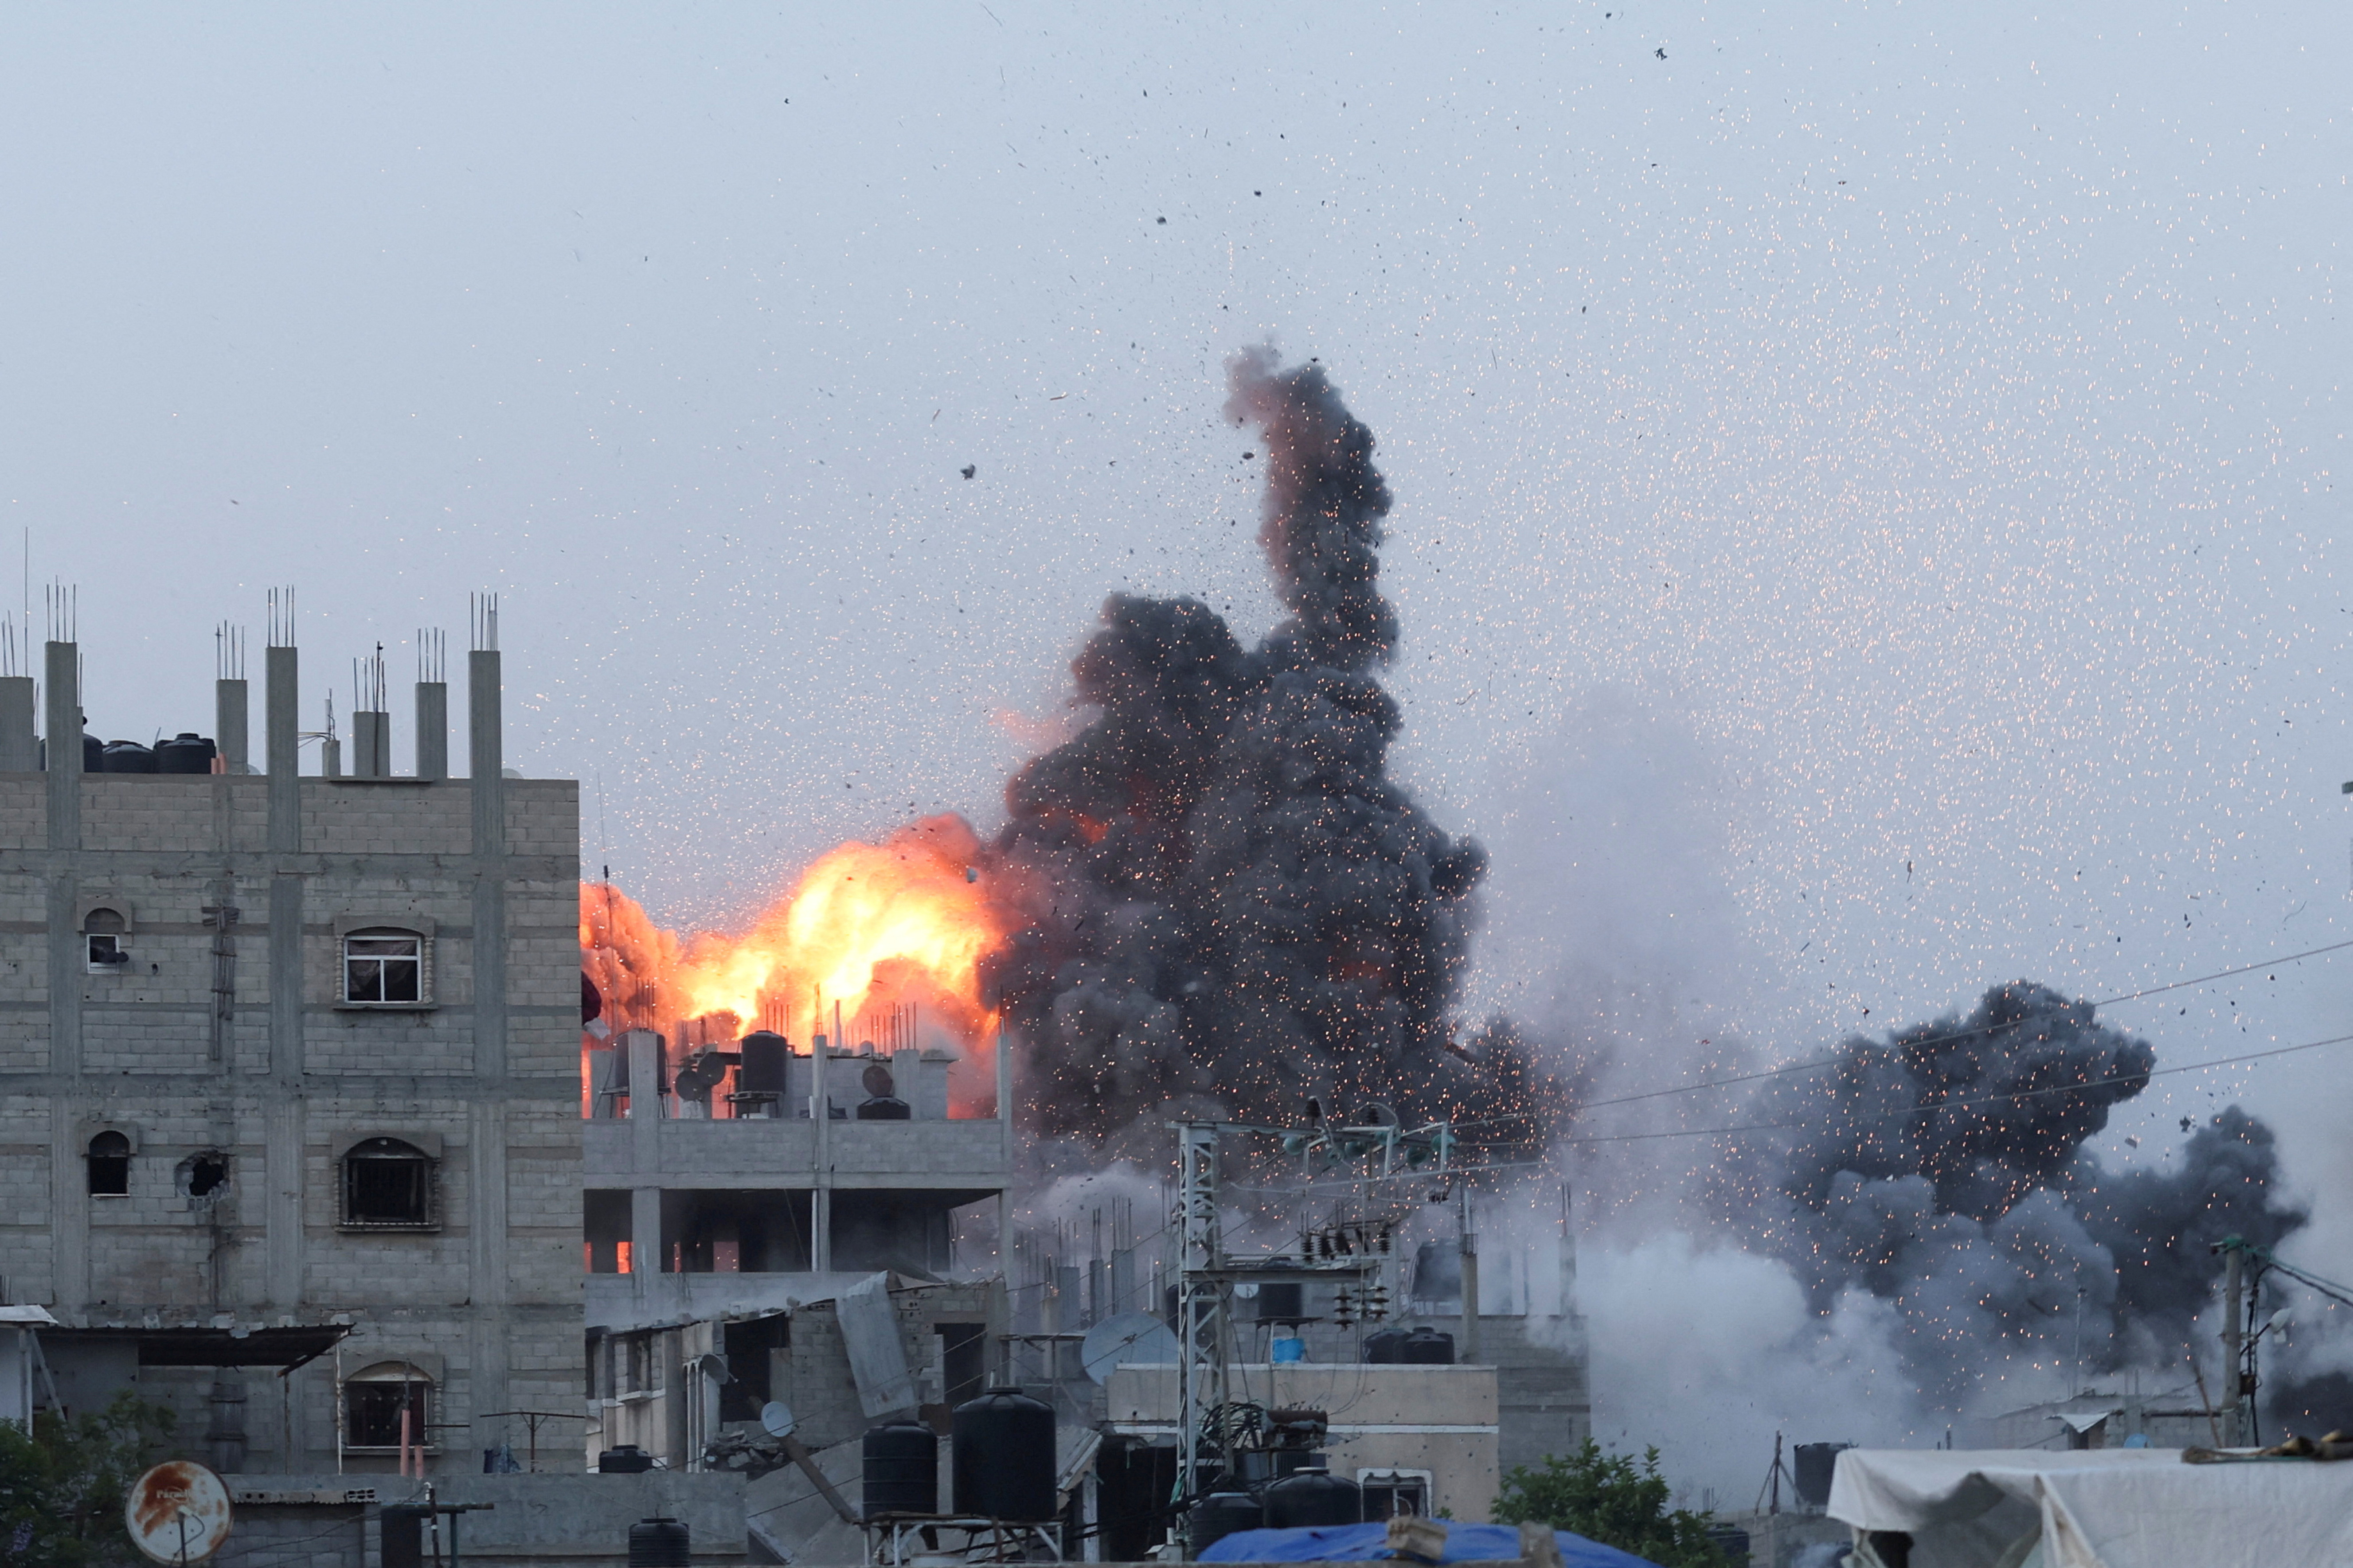
The U.S. said on Monday it wants the United Nations Security Council to adopt a resolution backing the proposal outlined by President Joe Biden to end fighting between Israel and Palestinian militants Hamas in the Gaza Strip.

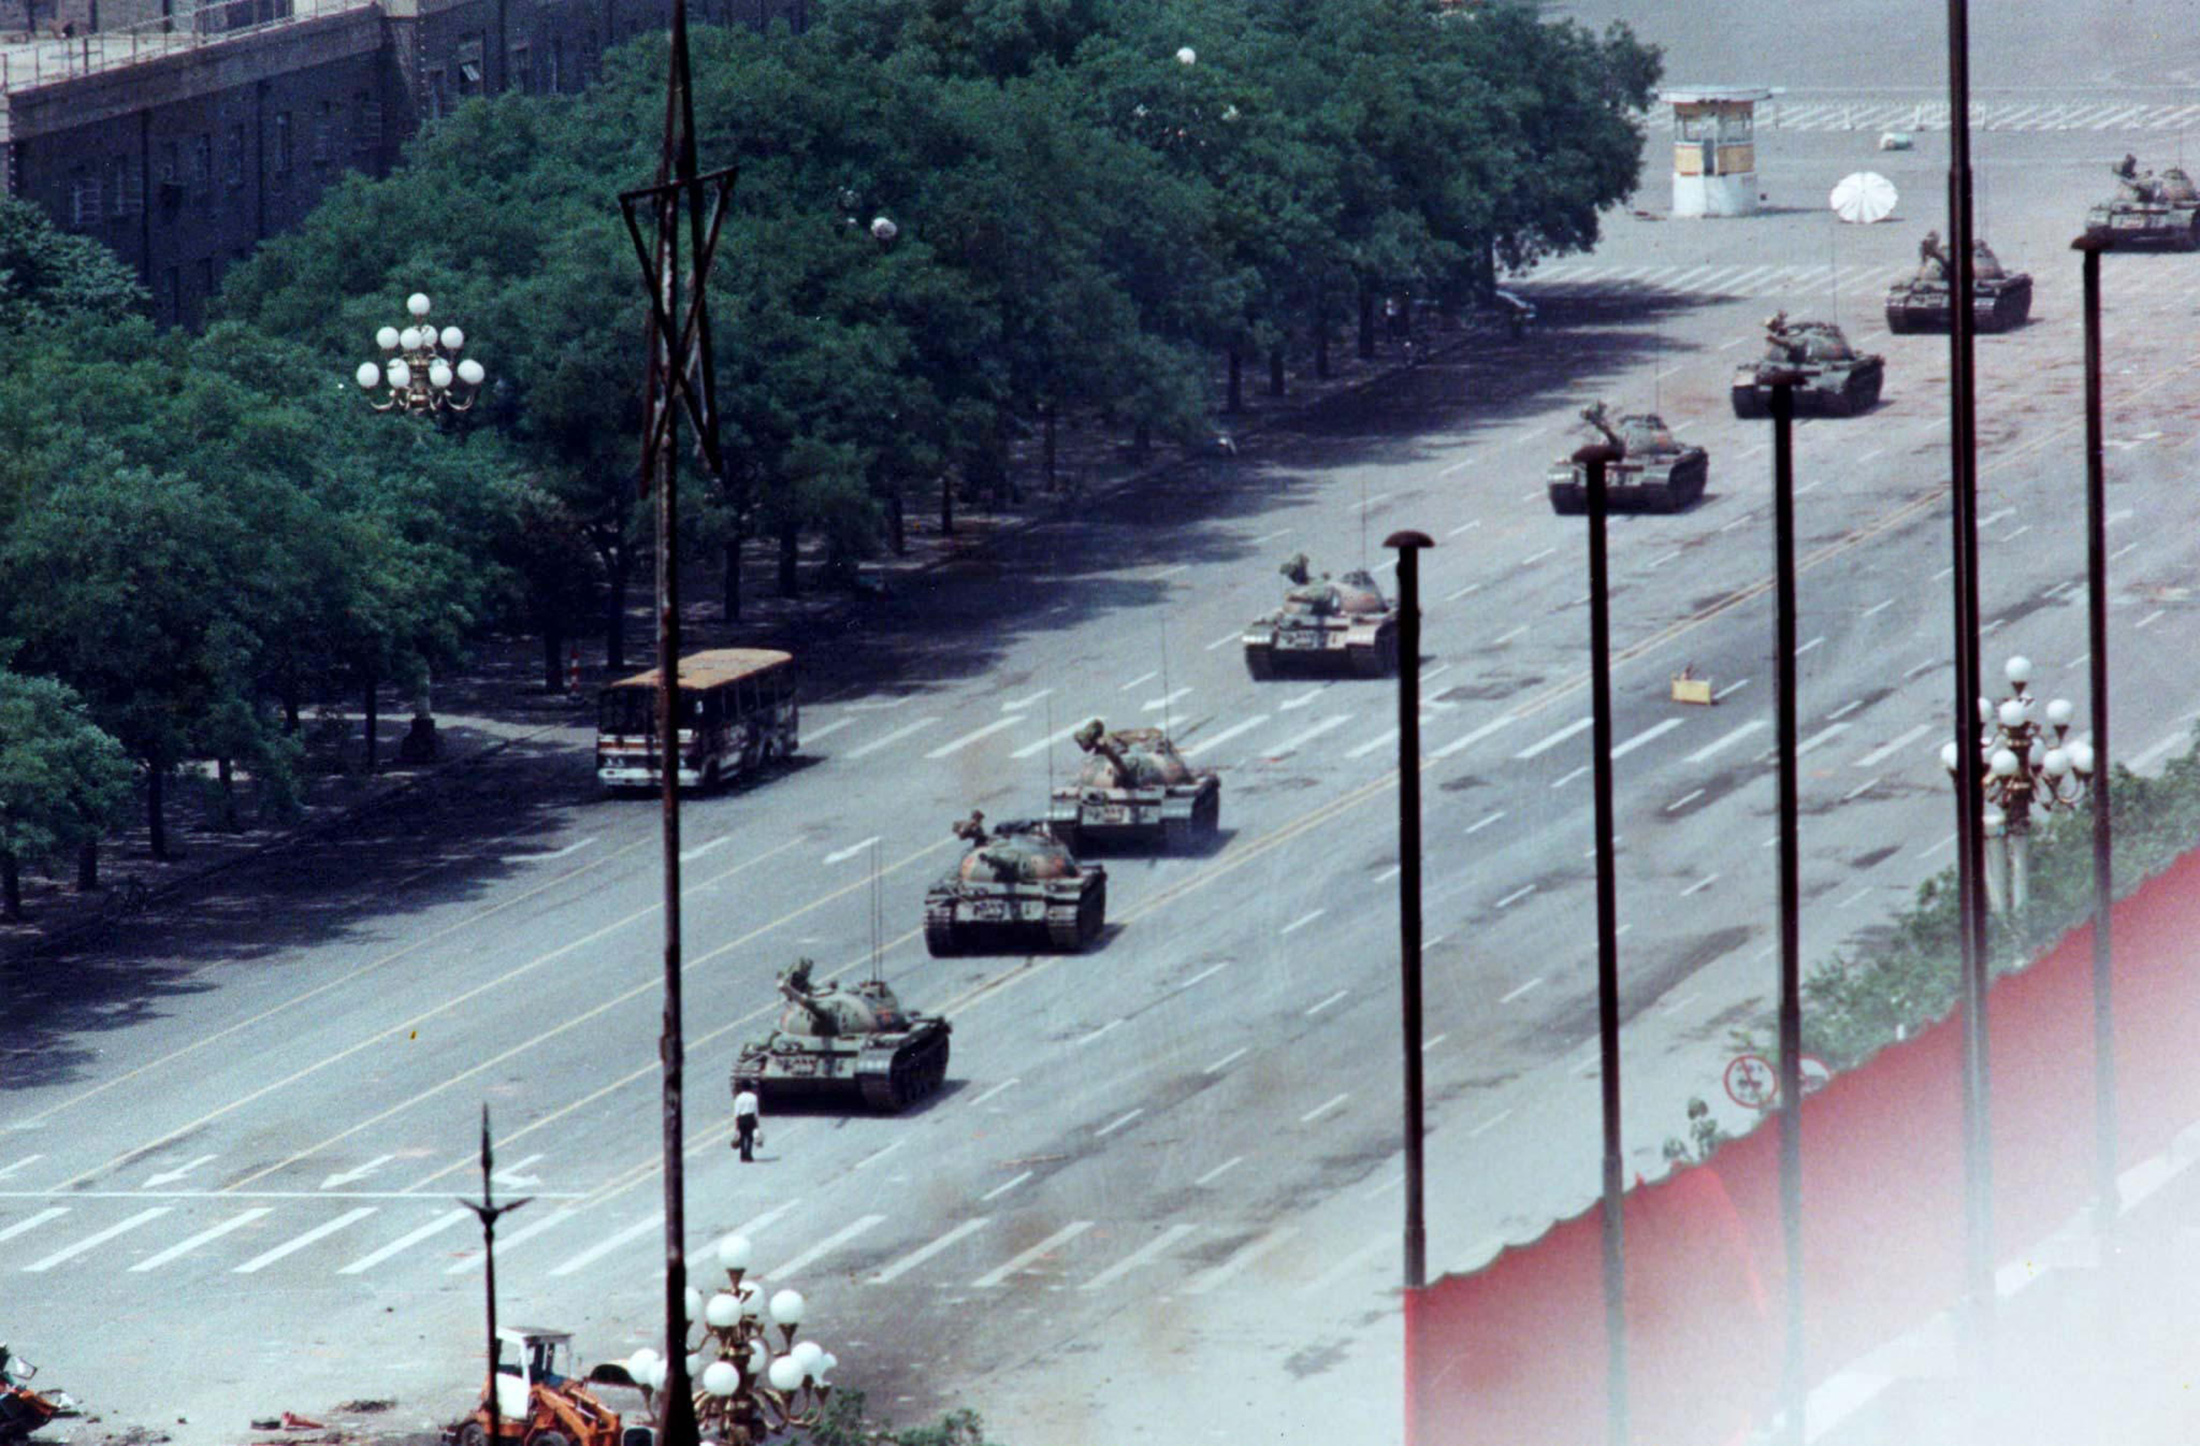
Tiananmen Square Anniversary
Security was tight and access restricted to Beijing's Tiananmen Square on Tuesday, the 35th anniversary of the June 4 crackdown, while Hong Kong police detained several activists, as cities in Taiwan and elsewhere prepared to mark the date with vigils.
Police stand guard at Causeway Bay, ahead of the 35th anniversary of the crackdown on pro-democracy demonstrators at Beijing's Tiananmen Square in 1989, near where the candlelight vigil is usually held, in Hong Kong, China, June 3, 2024. REUTERS/Tyrone Siu/File Photo - World
Taiwan President Lai Ching-te on Tuesday said he will work hard to make historical memory last forever and reach out to everyone who cares about Chinese democracy, on the 35th anniversary of the 1989 Tiananmen Square crackdown in Beijing.
- World
Tuesday marks the 35th anniversary of China's bloody crackdown on pro-democracy demonstrations in and around central Beijing's Tiananmen Square, when Chinese troops opened fire on their own people.


Markets


Talking Points

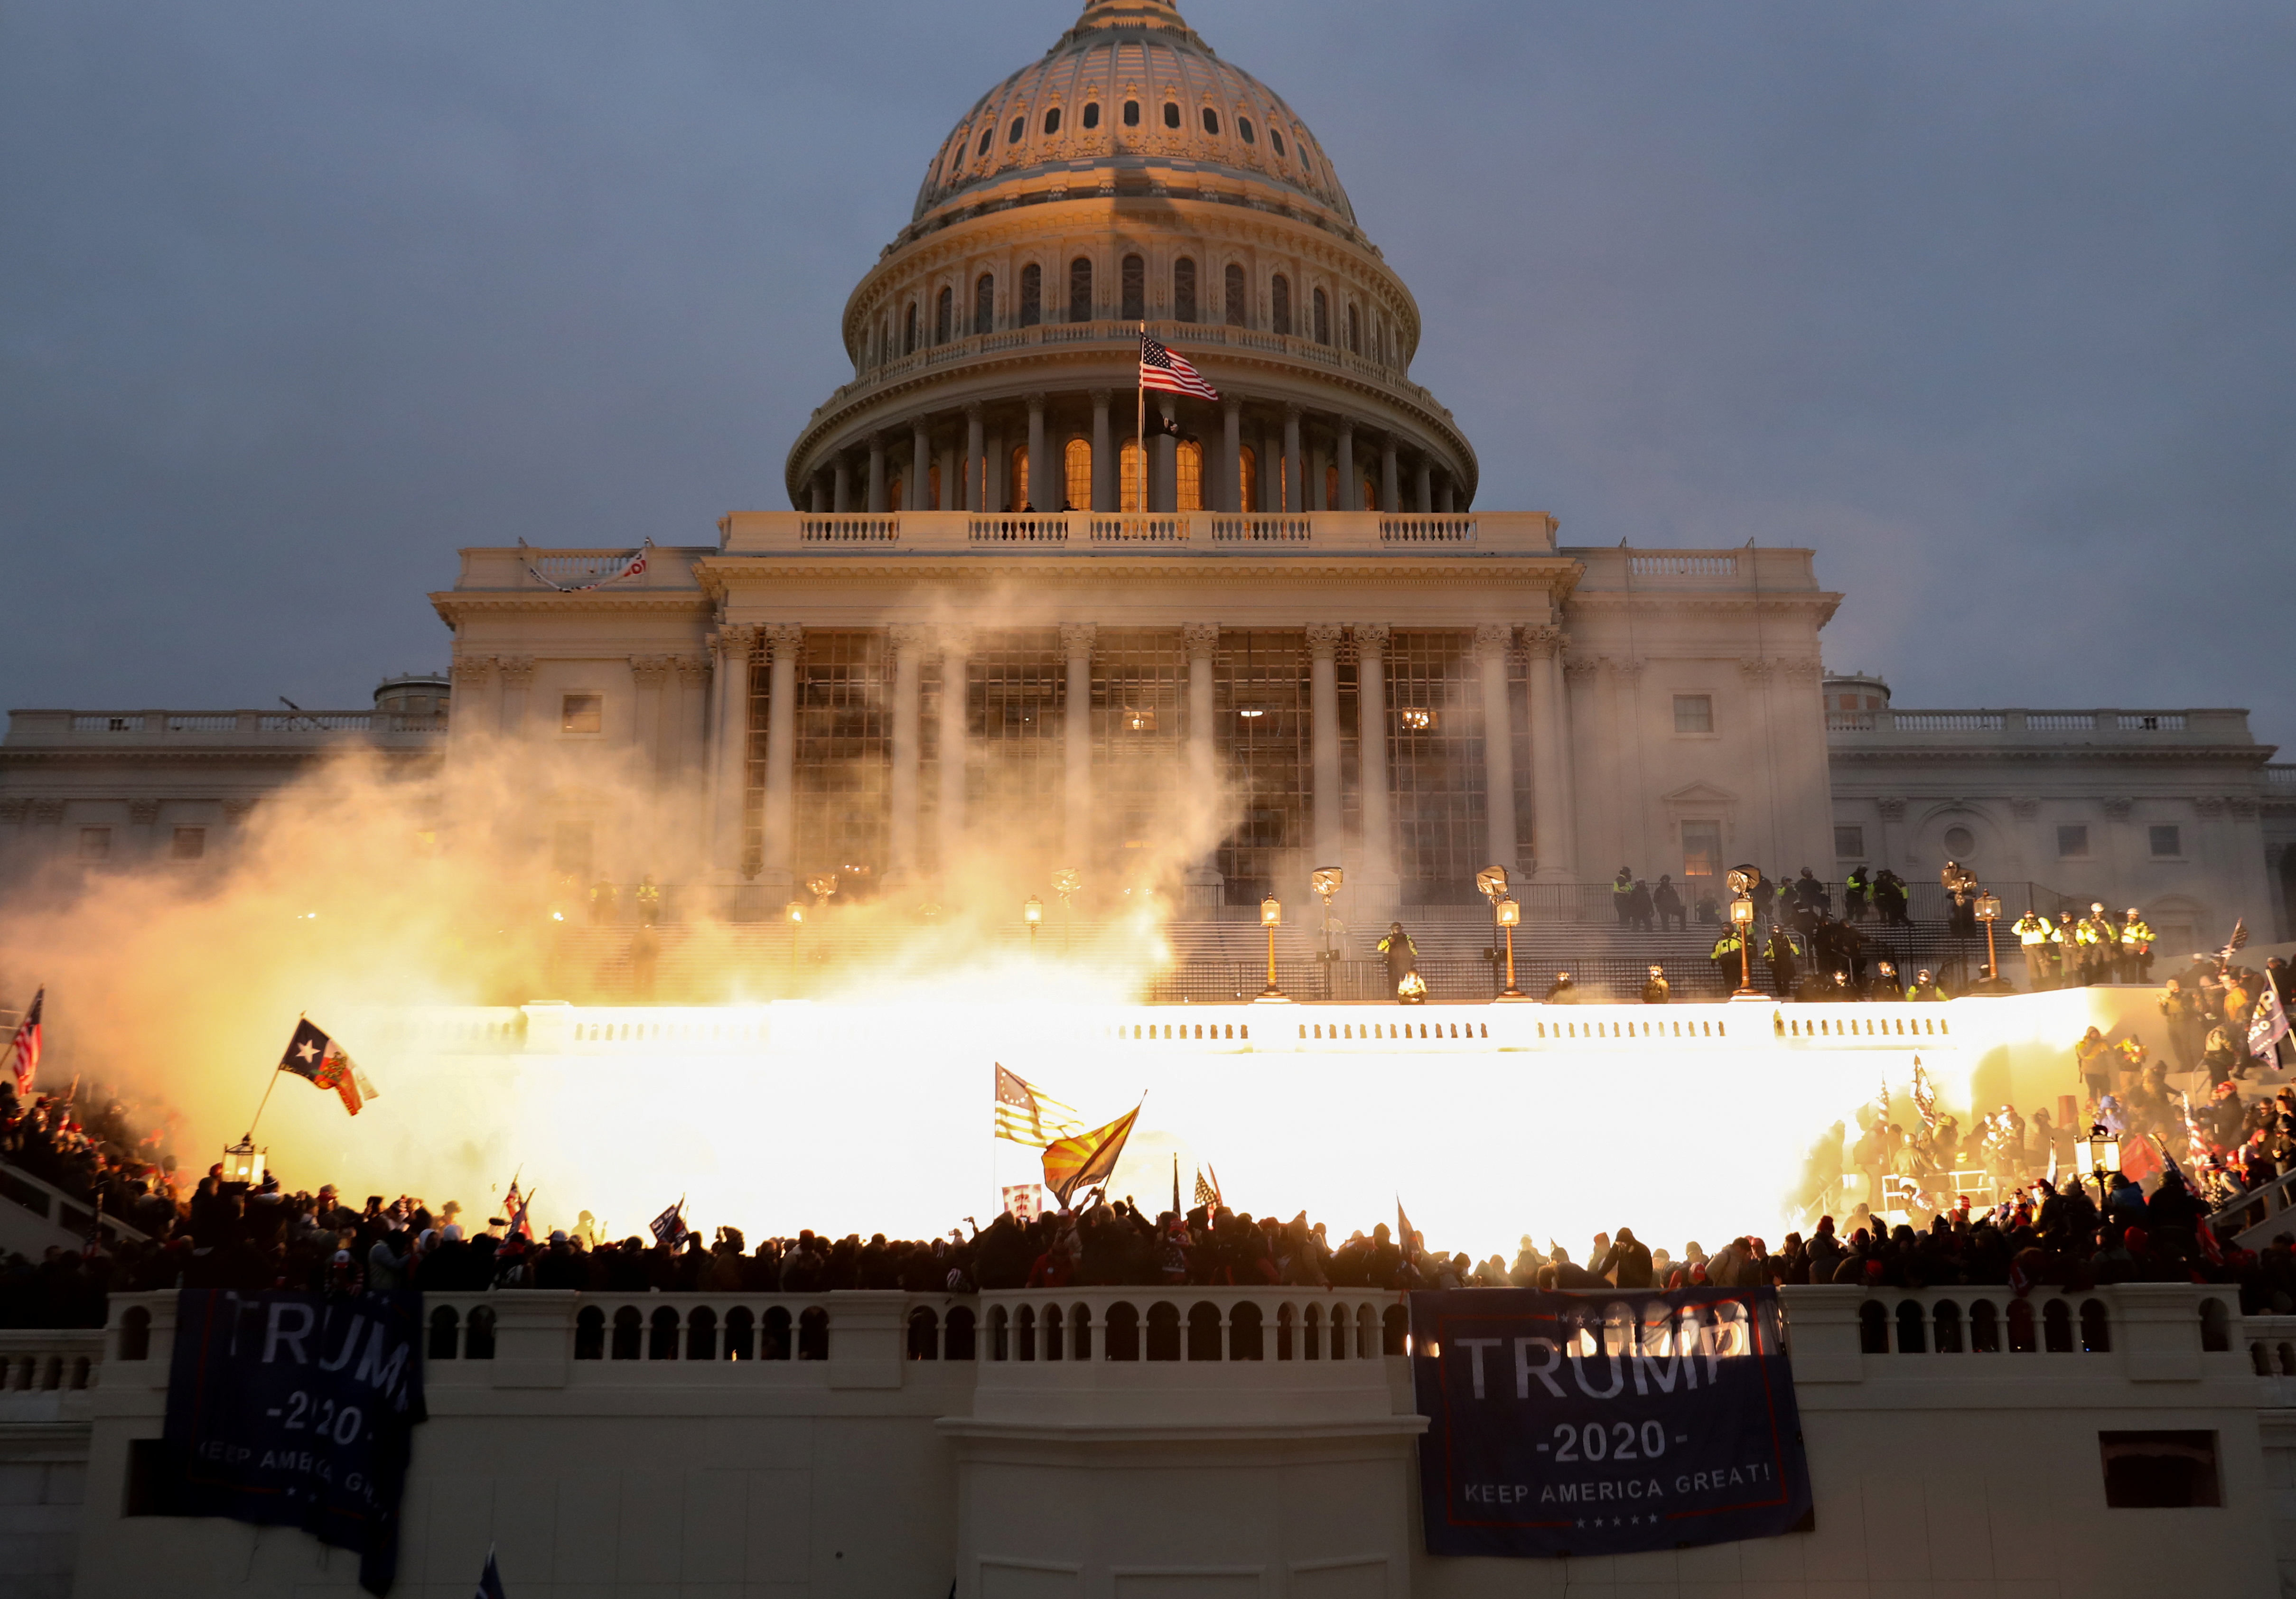
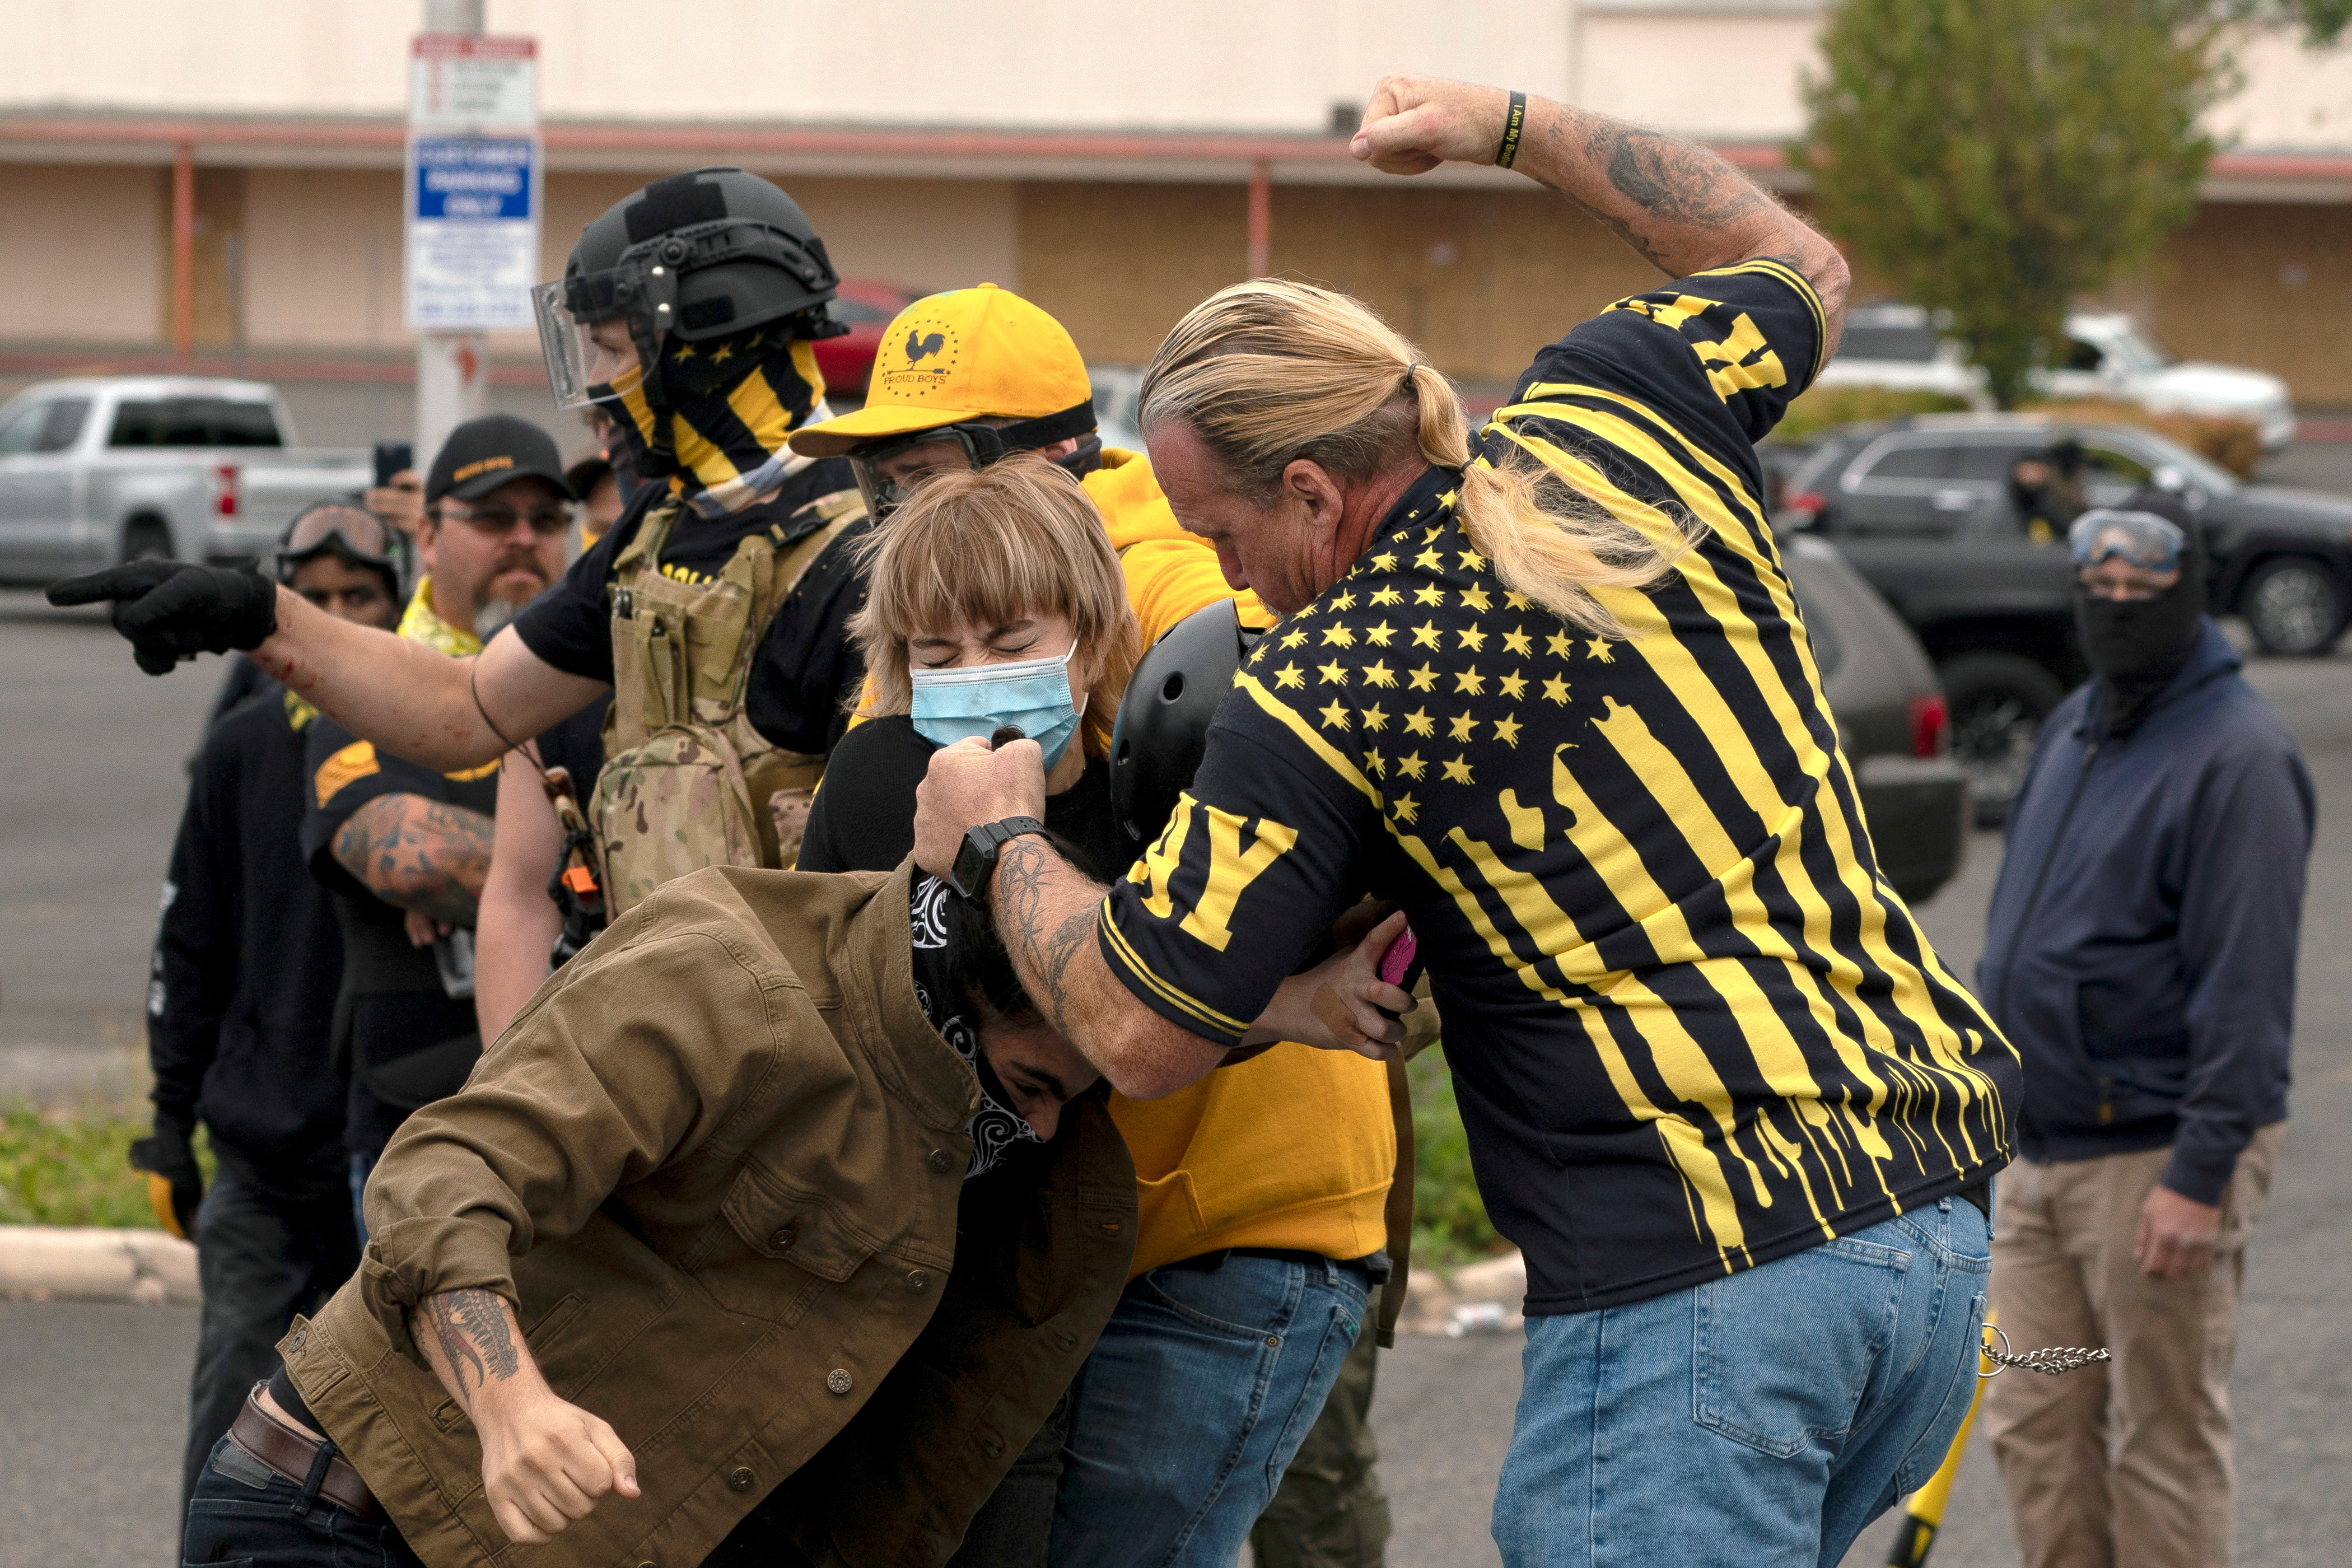
The Proud Boys are back. Four years after the failed effort to overturn Trump’s 2020 electoral defeat, the violent all-male extremist group that led the storming of Congress on Jan. 6, 2021, is rebuilding and regaining strength.
[1/4]A member of the far-right Proud Boys stands for a portrait before a campaign rally for former U.S. president and Republican presidential candidate Donald Trump in Wildwood, New Jersey, May 11, 2024. REUTERS/Jim Urquhart- Legal
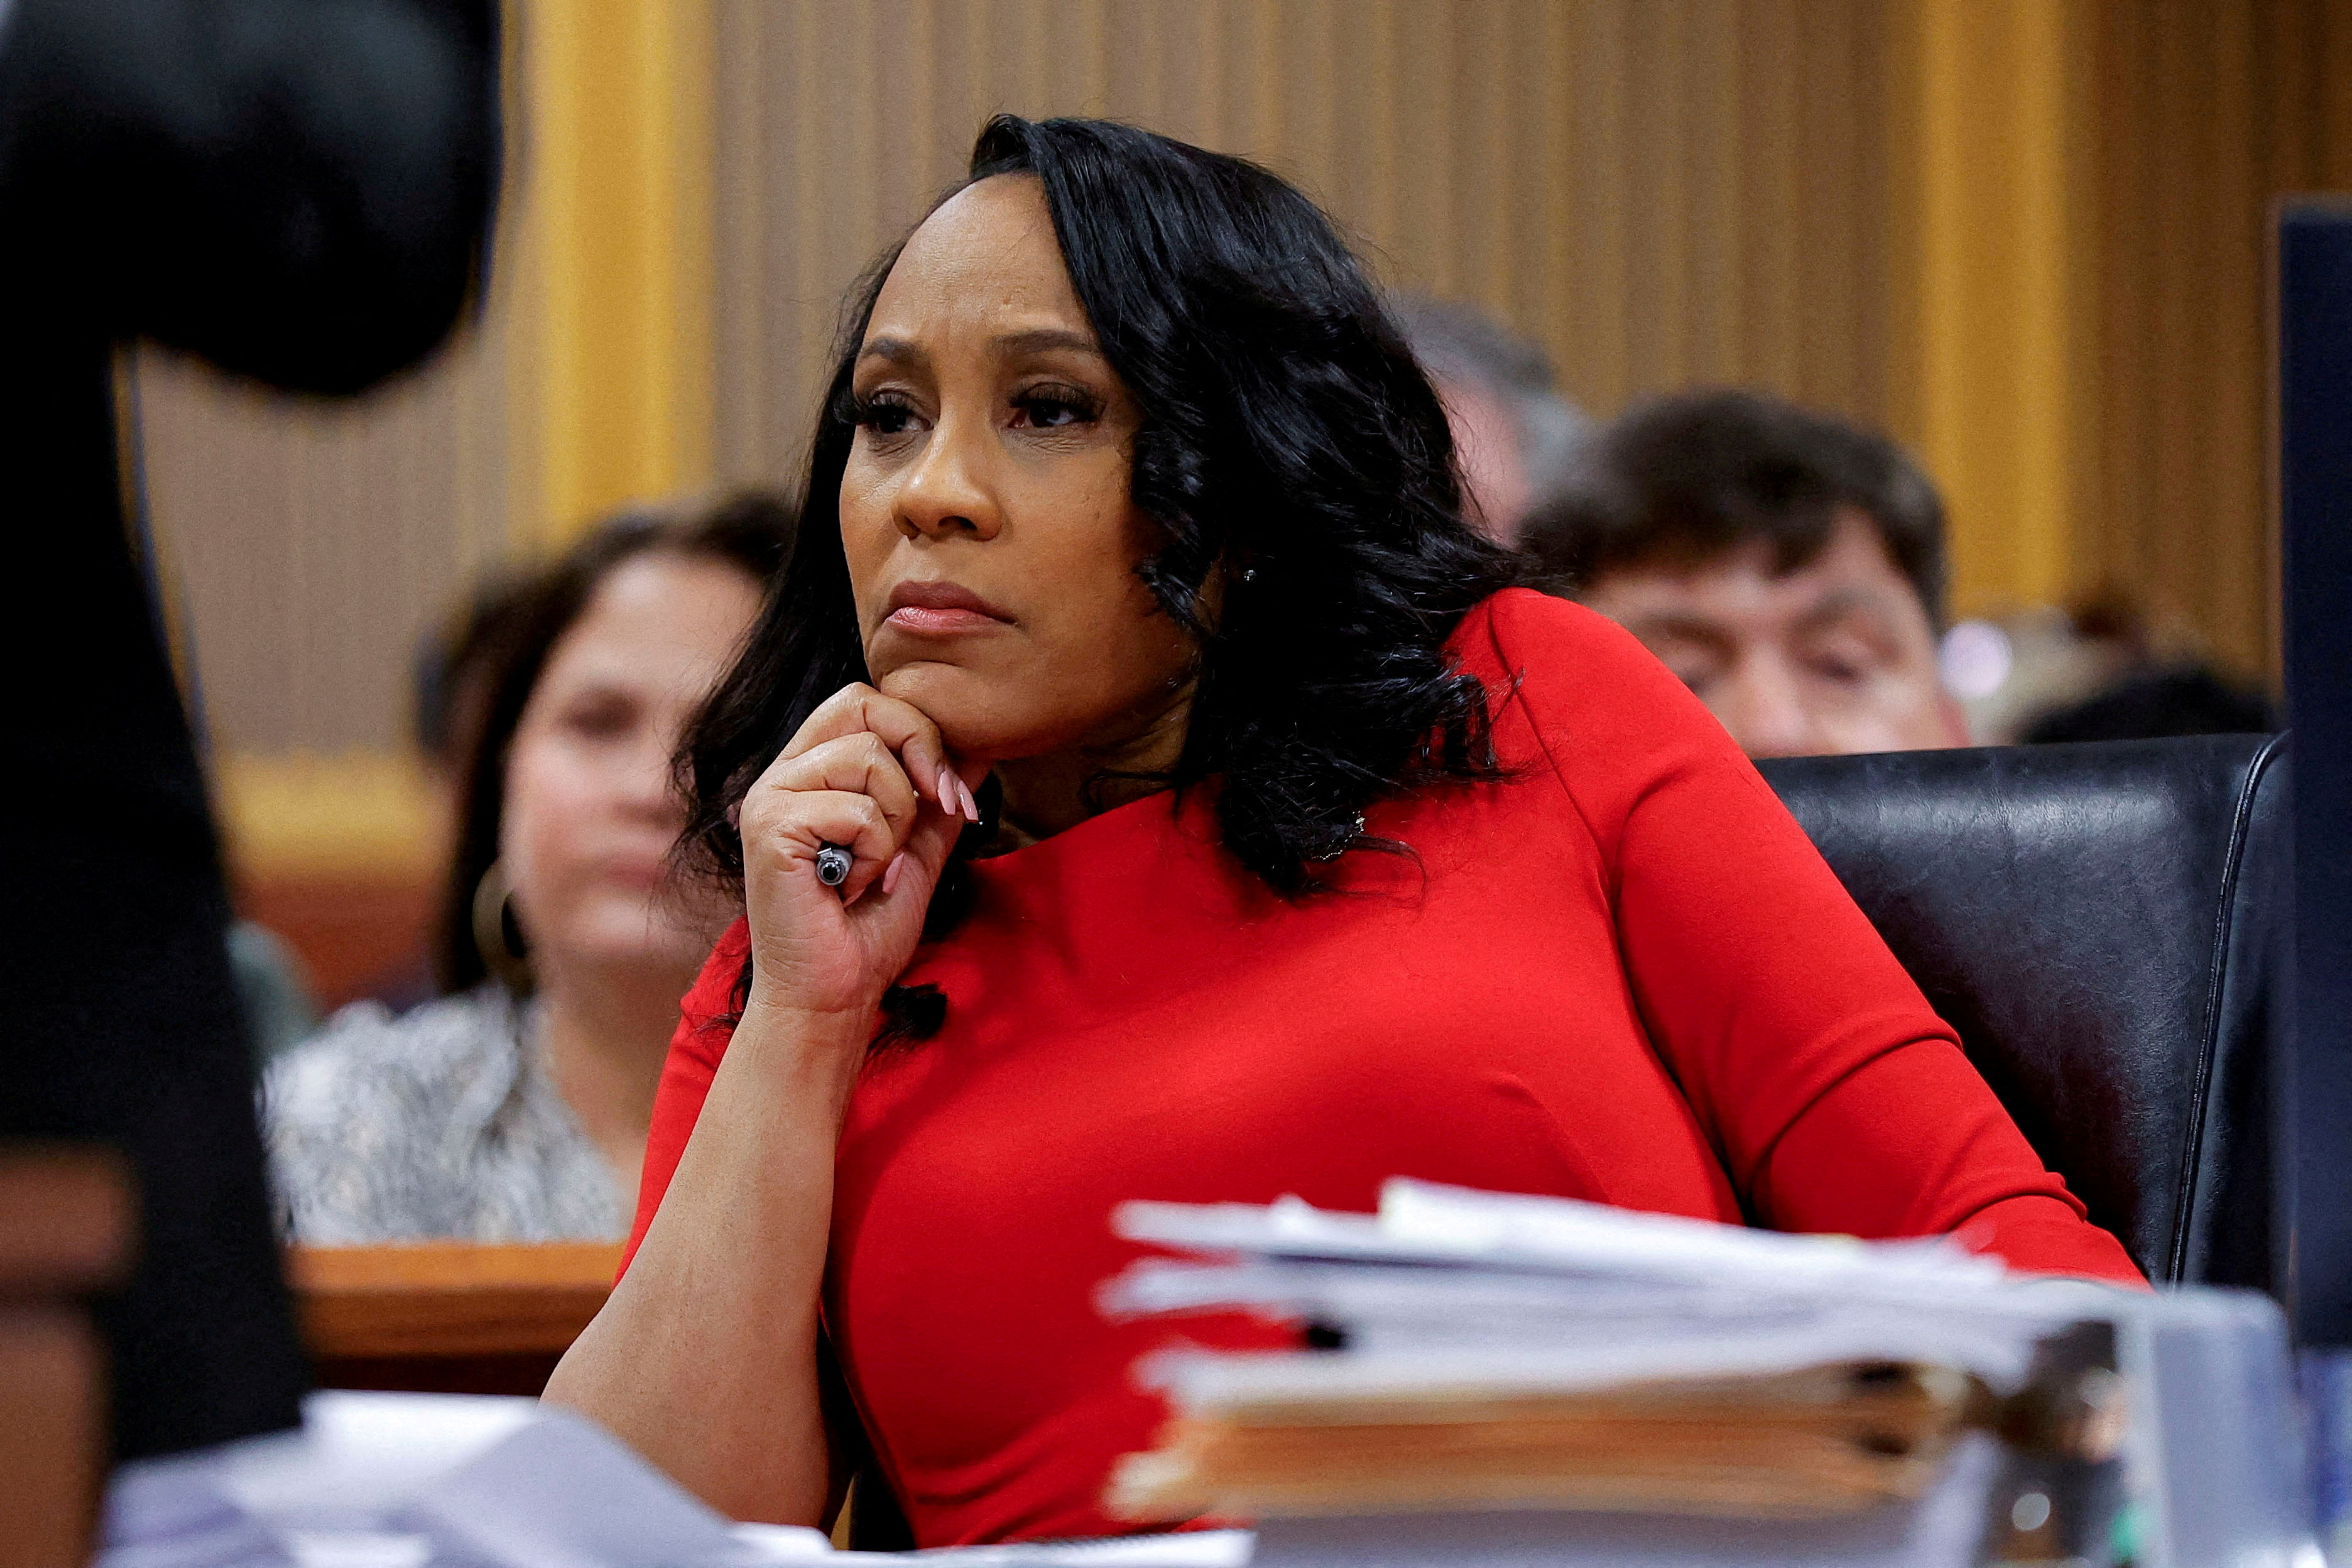
A Georgia appeals court will hear arguments in October on whether to disqualify Fulton County District Attorney Fani Willis from prosecuting Donald Trump for trying to overturn his 2020 defeat, a schedule that will likely postpone that trial until after the Nov. 5 election.
- World
President Joe Biden on Monday for the first time called former President Donald Trump a "convicted felon" who poses a higher threat to the United States if he wins another term - the most biting attack on his opponent's legal troubles to date.


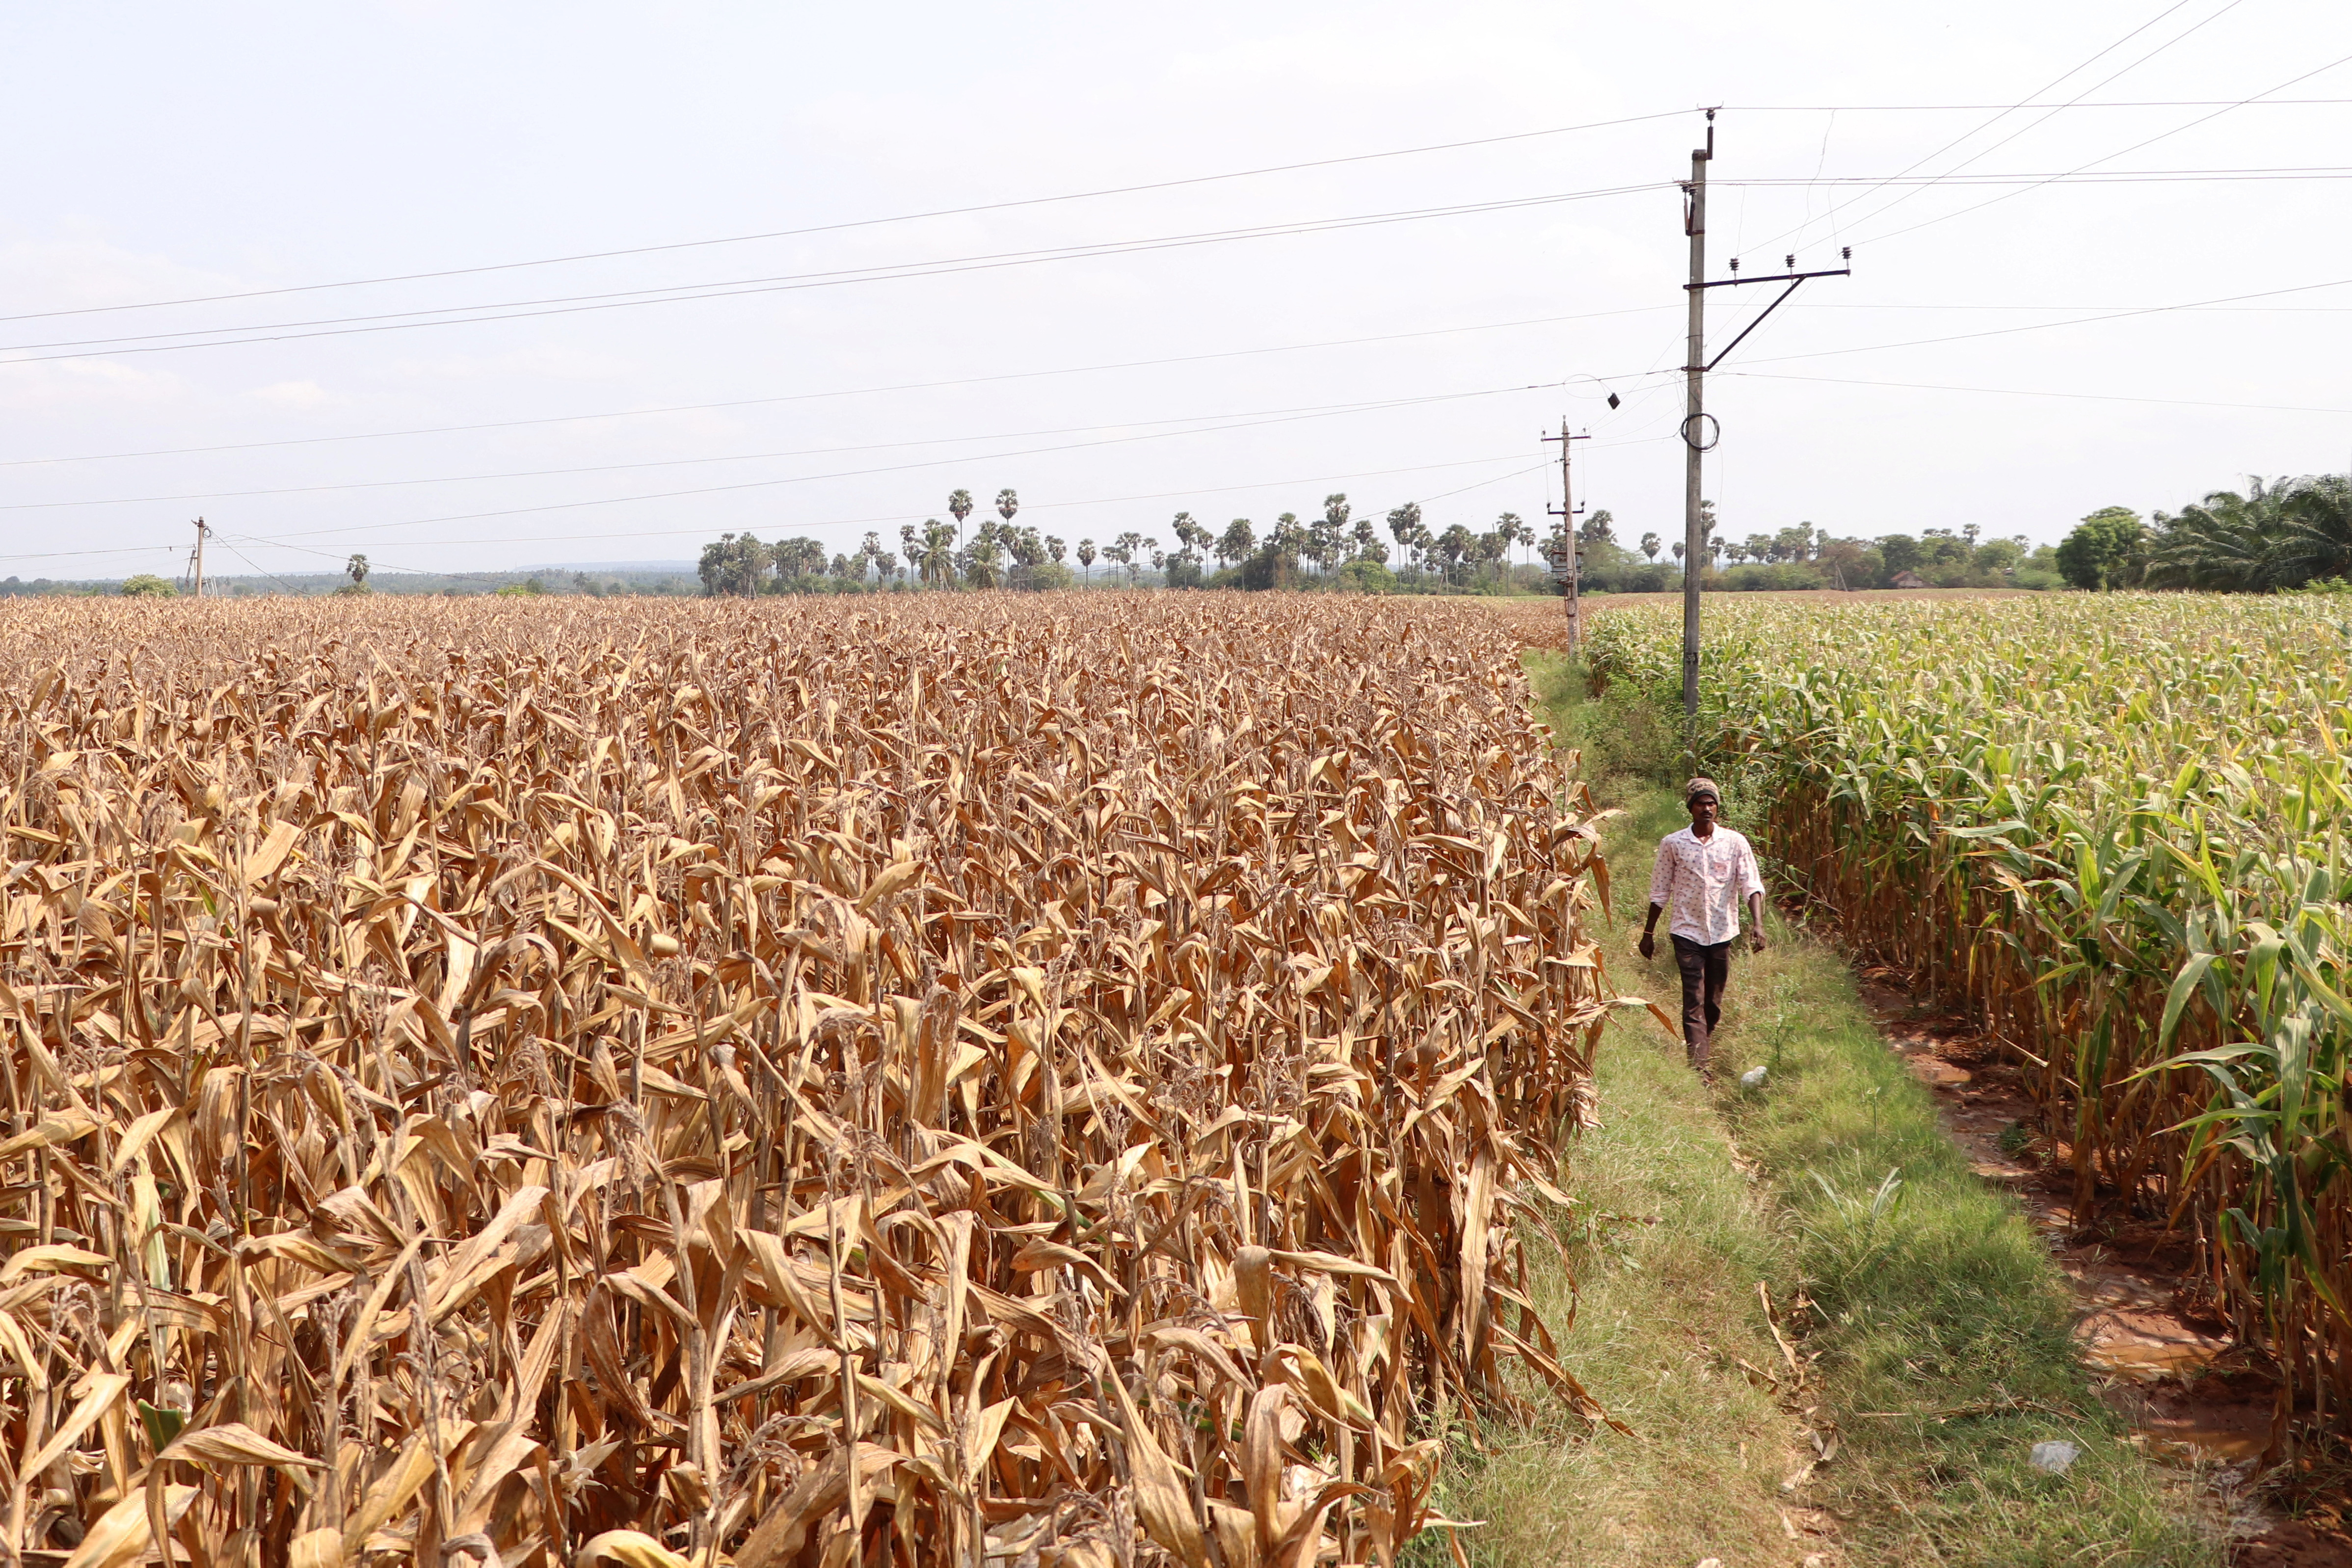
As the local climate has heated up over decades, rivers and lakes have also shrunk.

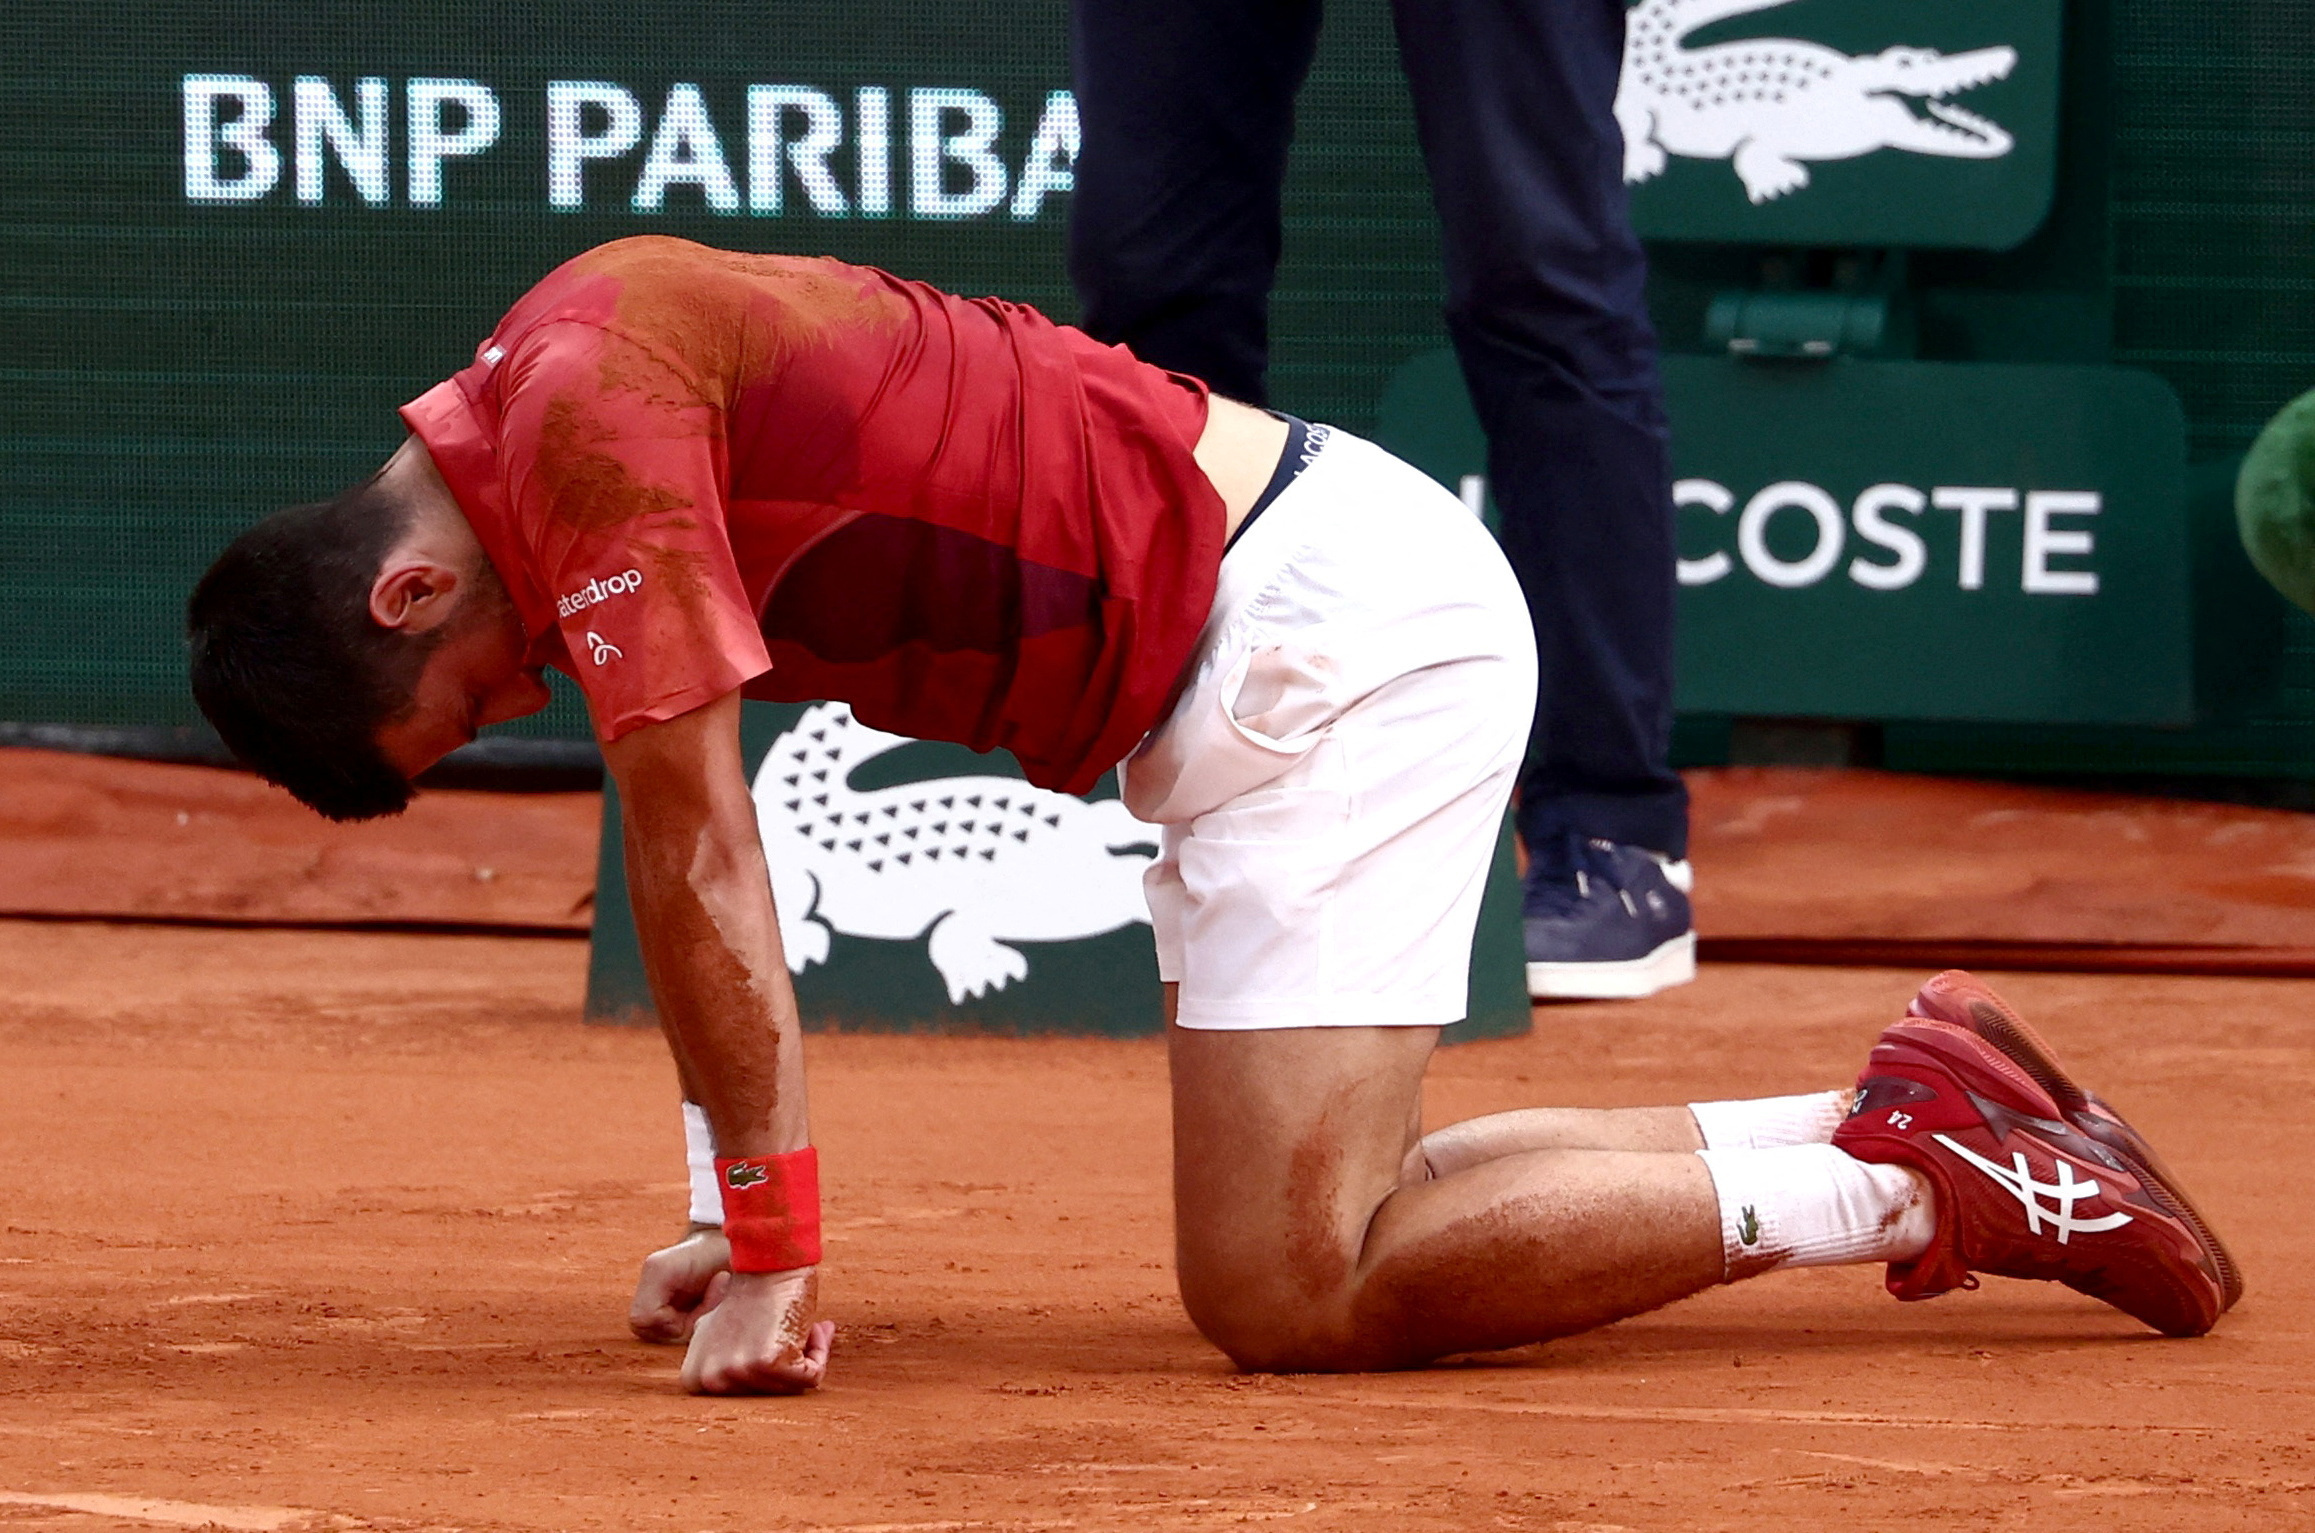
Novak Djokovic sparked concerns about his injured knee for the rest of his French Open title defence, with the top seed saying he briefly considered pulling out midway through his five-sets win over Argentine Francisco Cerundolo on Monday.
Tennis - French Open - Roland Garros, Paris, France - June 3, 2024 Serbia's Novak Djokovic reacts after falling during his fourth round match against Argentina's Francisco Cerundolo REUTERS/Yves Herman - Sports
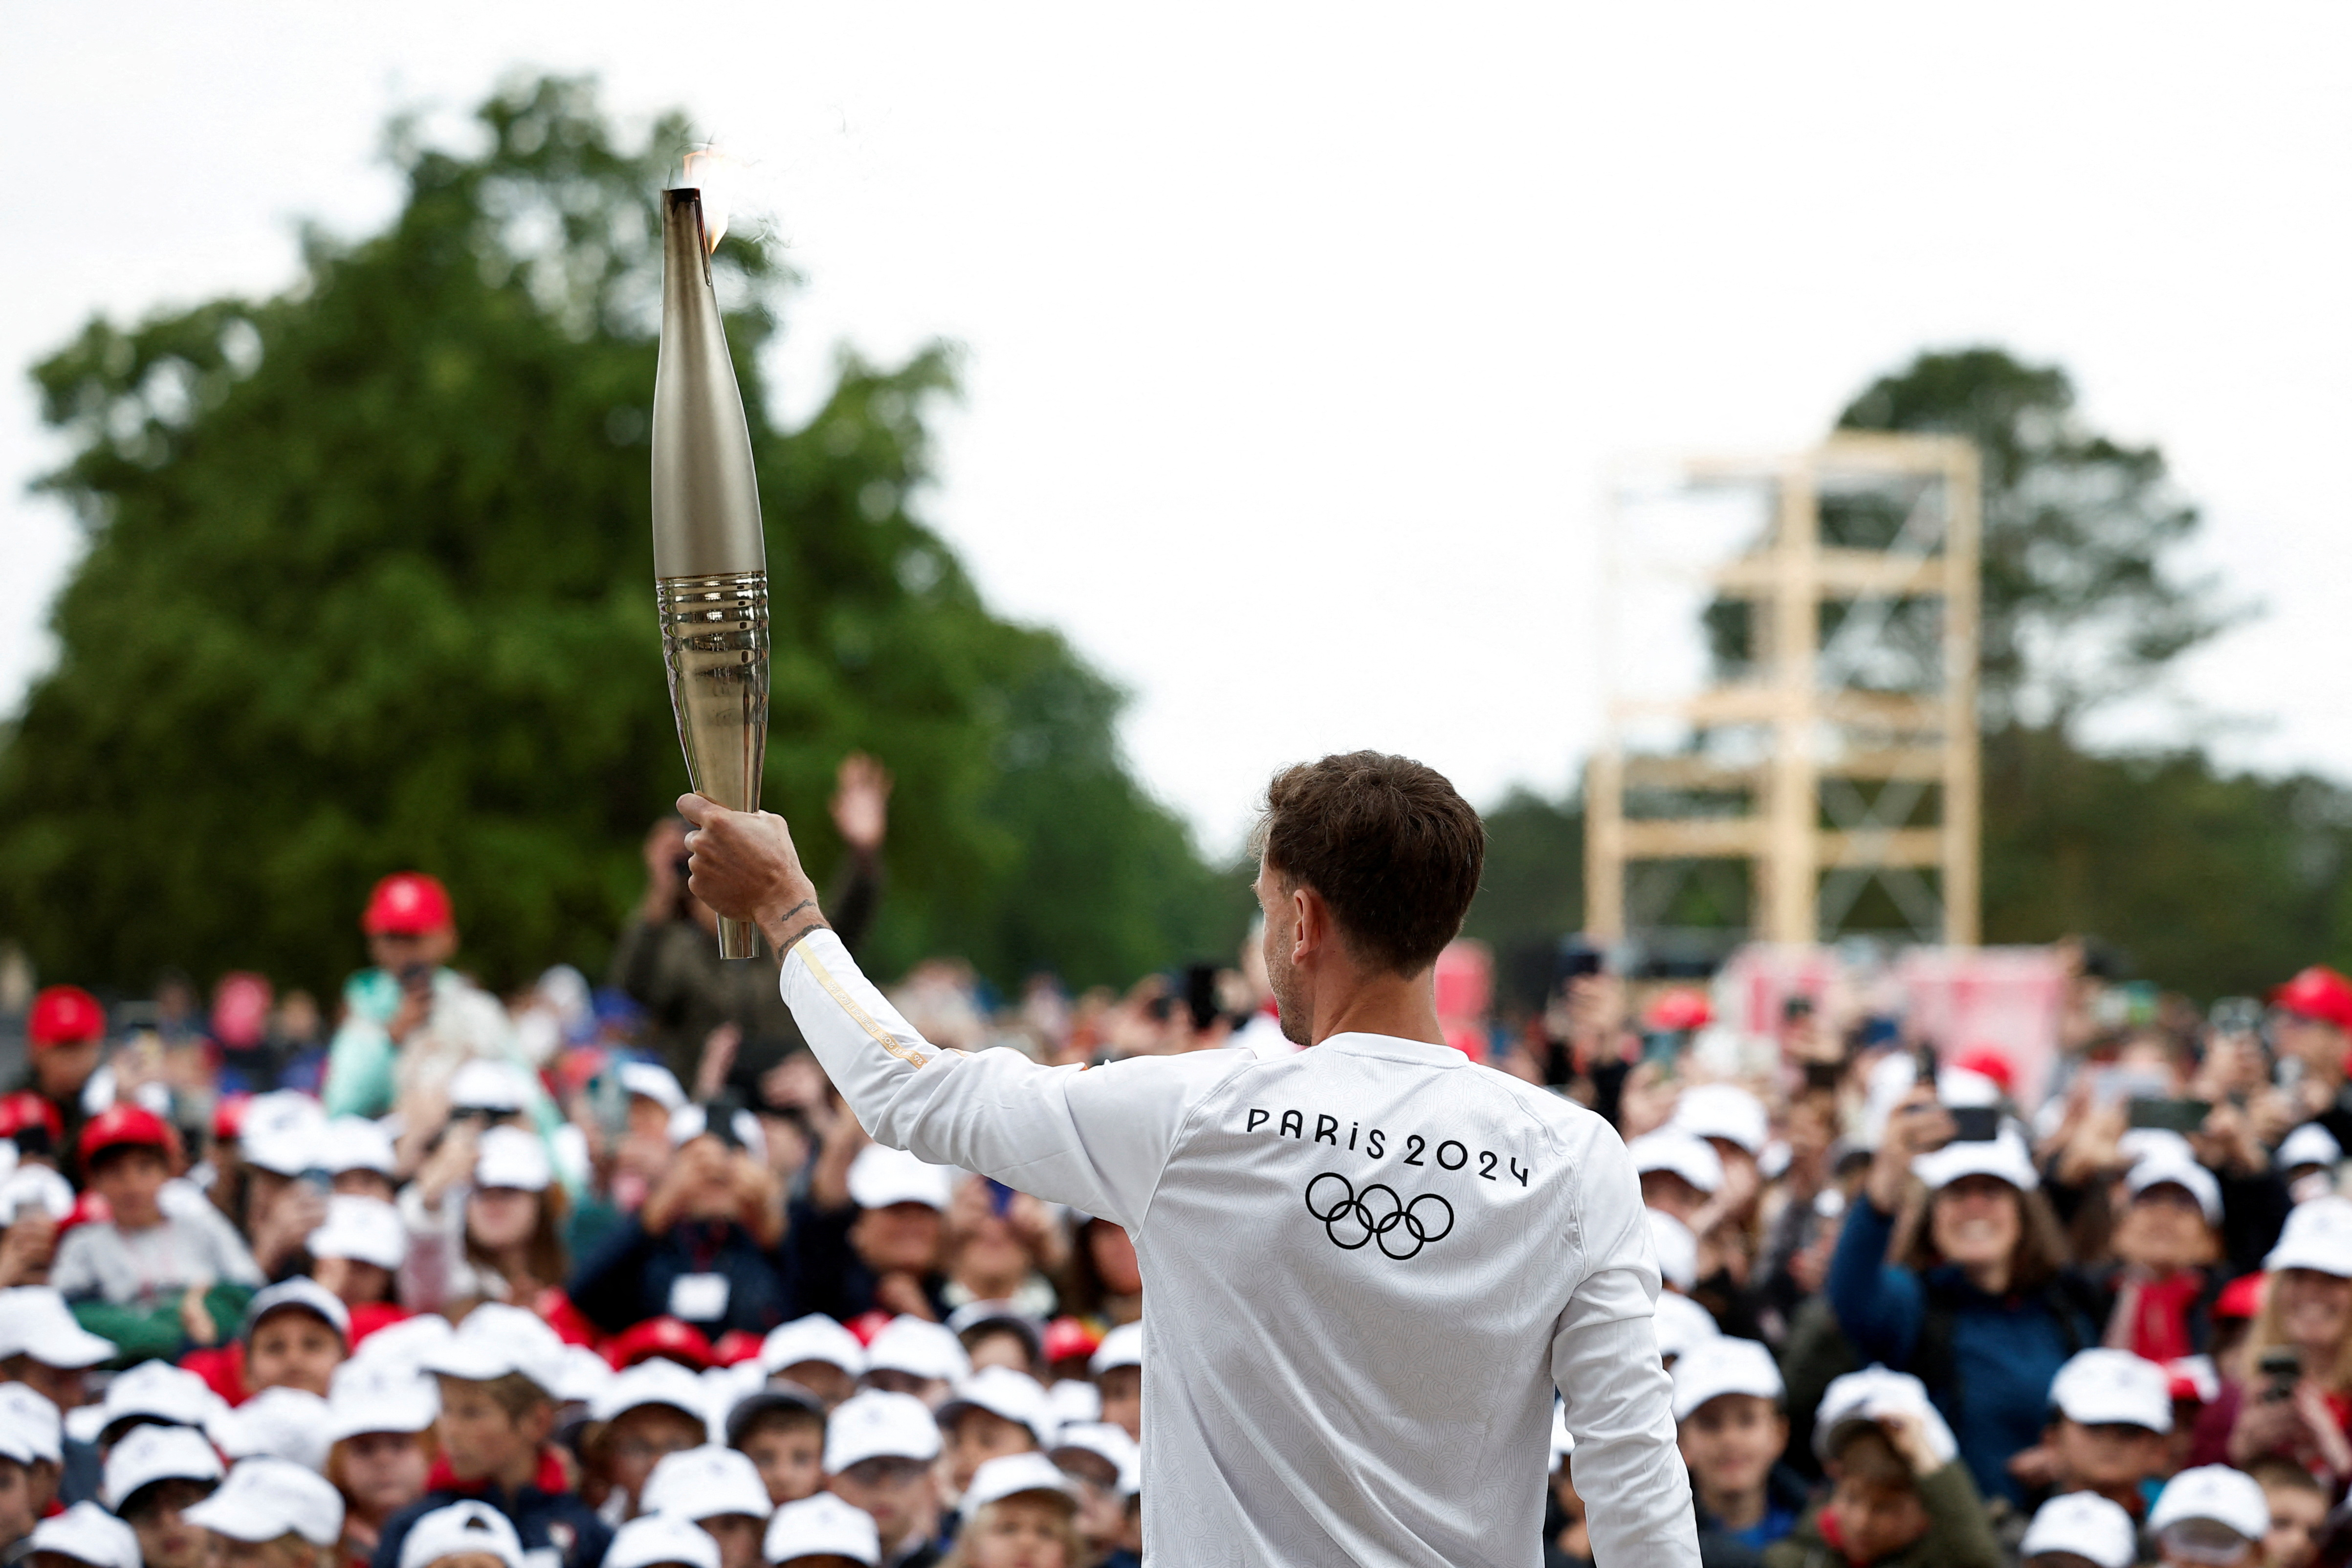
When a group of mayors paid tens of thousands of euros each to bring the Olympic torch to their towns along France's Atlantic coast, a row erupted over whether the cost represented value for money at a time when public spending is under pressure.
- Sports
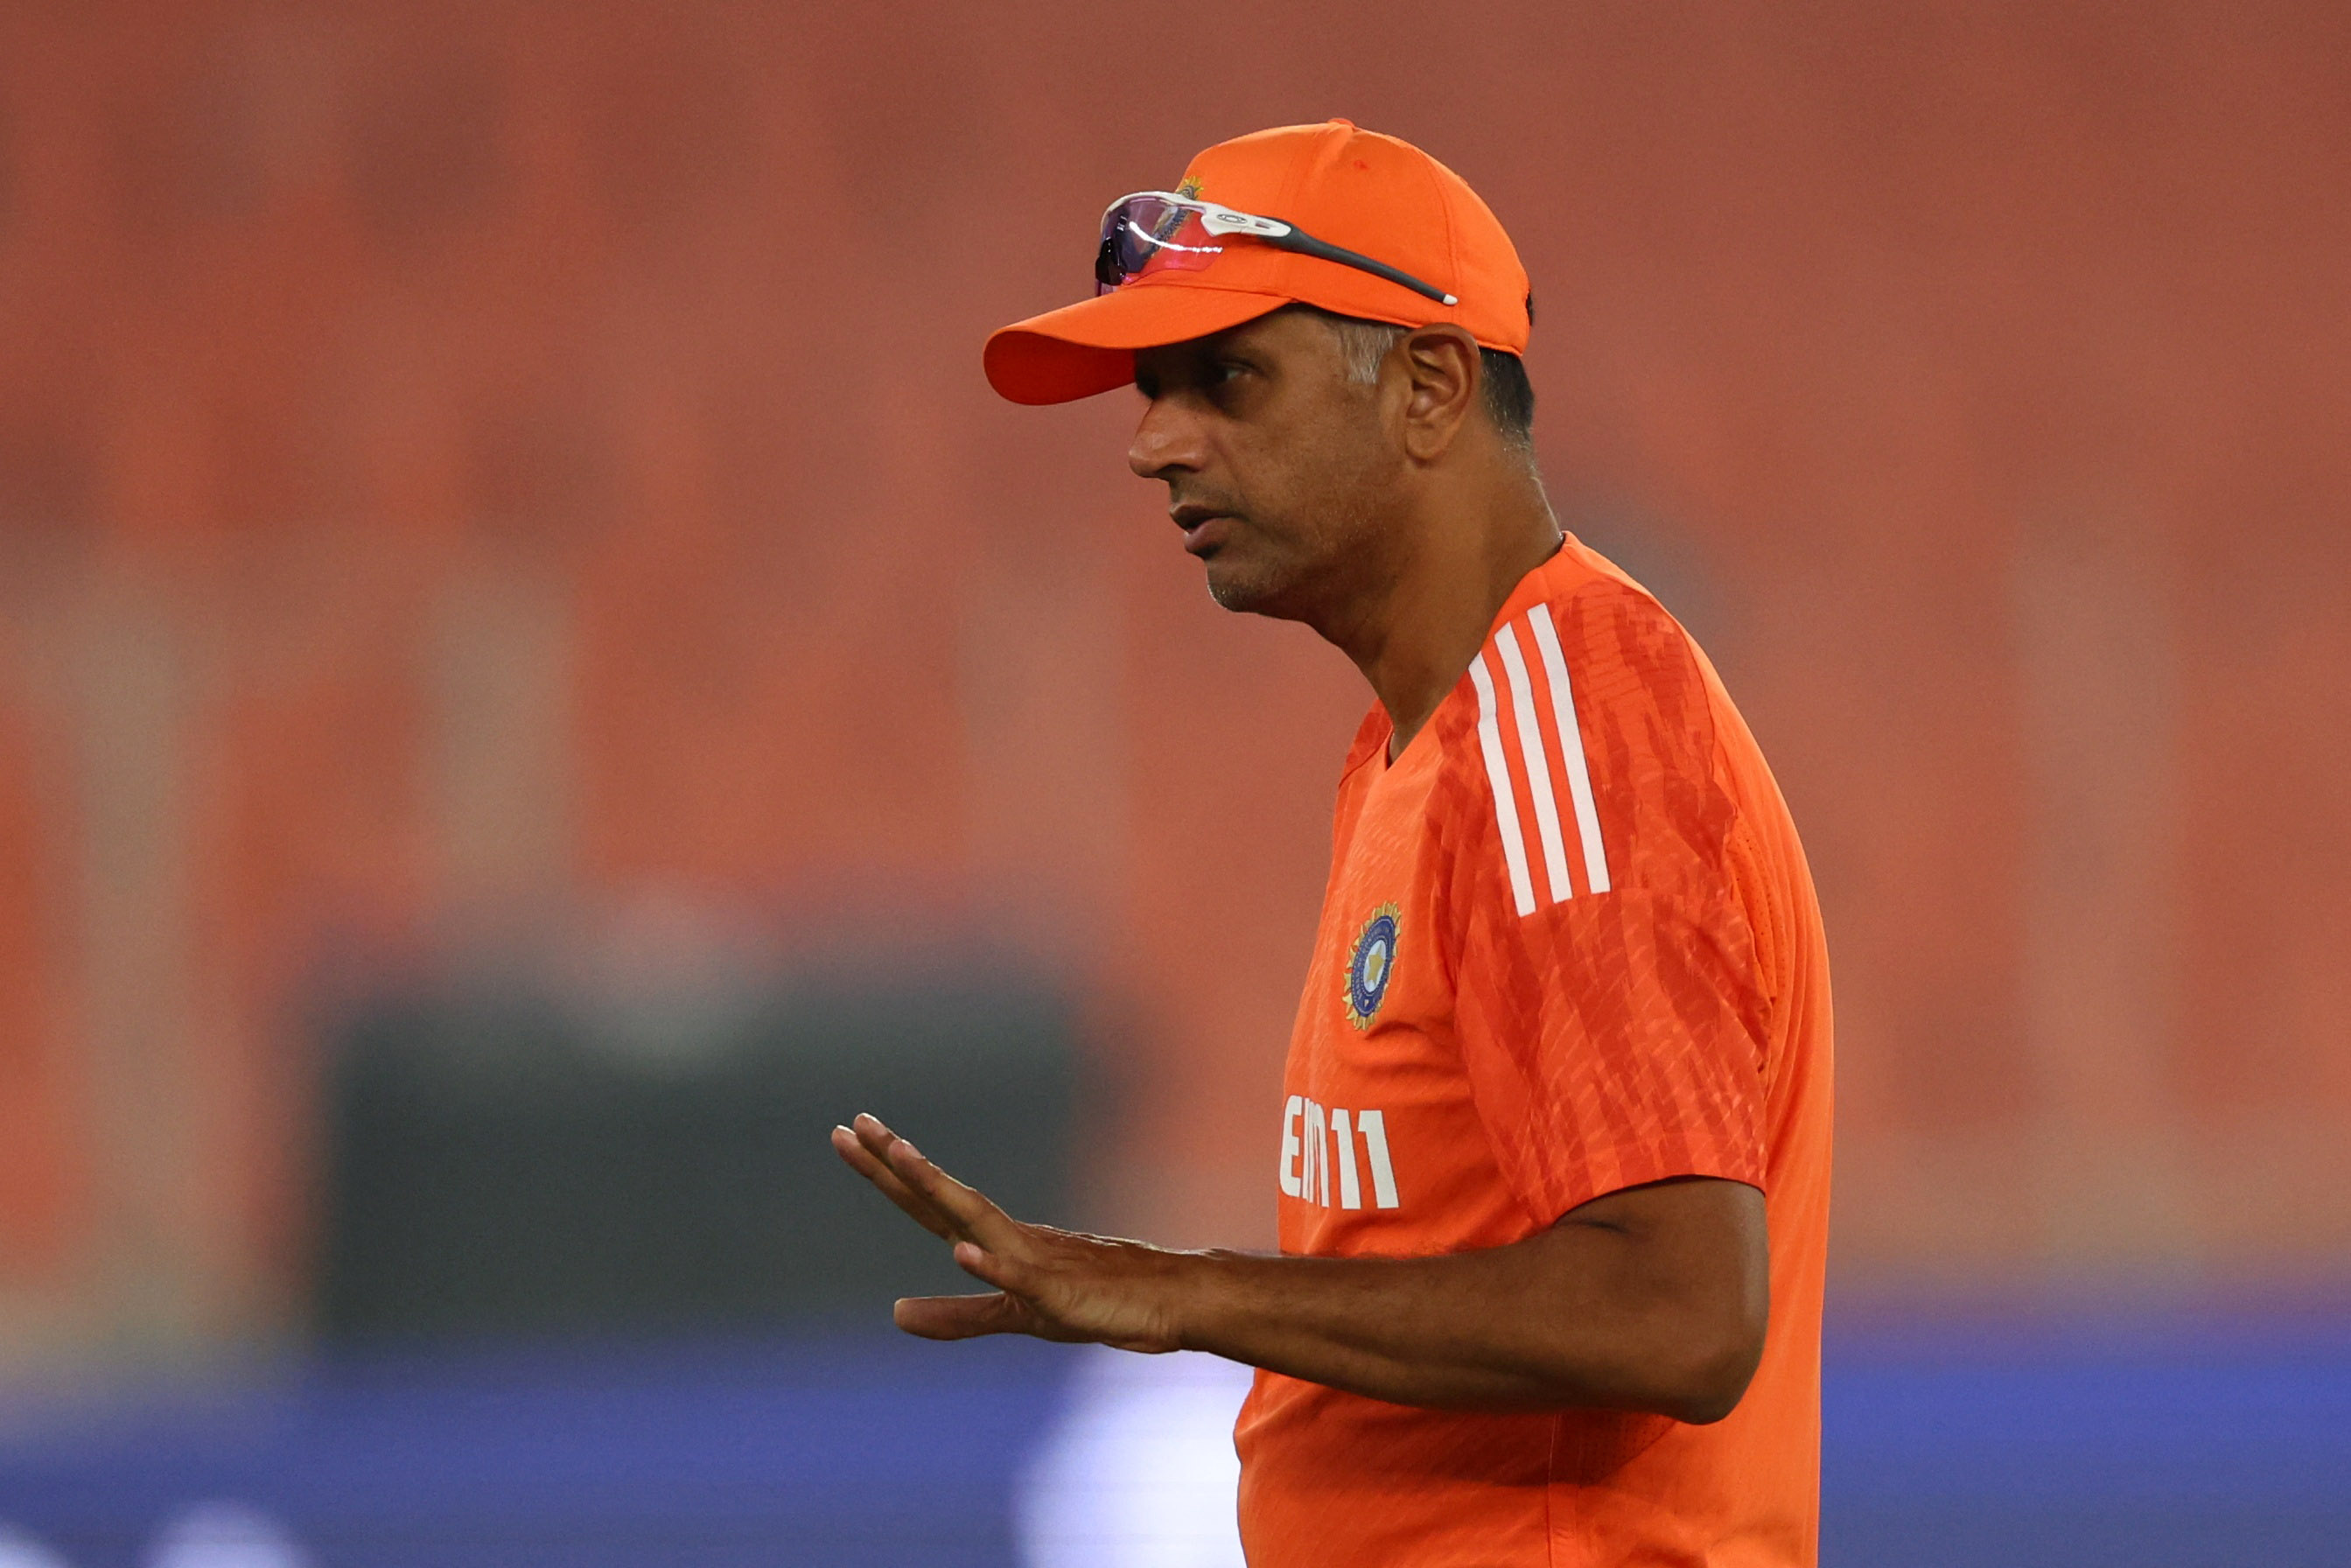
India head coach Rahul Dravid will leave his post at the end of the ongoing Twenty20 World Cup after almost three years in charge and has no plans to re-apply for the position, the 51-year-old said late on Monday.